Why the Rich Tend to Cheat on Their Brokers

For affluent Americans, having more than one financial adviser has now become the norm.
One in three Americans with more than $100,000 in investable assets started a relationship with a new financial services firm last year, seeking to combine the strengths of various firms to gain advice and resources, according to a new study released Tuesday by Hearts & Wallets, a financial research platform for consumers.
Related: The 6 Times You Really Need a Financial Adviser
Hearts & Wallets also noted that 55 percent of consumers with $500,000 in investable assets or more work with three or more firms.
Contrary to the popular image of wealthy investors dialing up their Wall Street broker, the Hearts & Wallets survey found that affluent investors are more likely to use self-service firms — discount brokerages like E*Trade or TD Ameritrade — than full-service brokers. More than 70 percent of investors with $500,000 or more use those self-service brokers, even if it’s for smaller “play money” accounts, compared with 40 percent for full-service firms such as Ameriprise and Edward Jones.
“It’s astonishing the self-service competitive set has deeper reach into investors with $500,000-plus, engaging more affluent investors than the full-service competitive set,” said Laura Varas, Hearts & Wallets partner and co-founder, in a press release.
Related: 6 Traits of an Emerging Millionaire: Are You One?
Some wealthy investors use both. A common pattern is what Hearts & Wallets calls “stable two-timing,” or when investors balance a self-service firm with a full-service firm. Some consumers might even tap into multiple high-service firms to obtain different advice.
“Just as in retail stores, wealthy customers may trust and frequent a Bloomingdale’s, but they will still shop at Costco, too,” Varas said. “Smart consumers compare.”
Top Reads from The Fiscal Times:
- The 5 Worst Money Mistakes of Millionaires
- IRAs: Everything You Need to Know for 2015
- The Worst States For Retirement in 2015
Tax Refunds Rebound
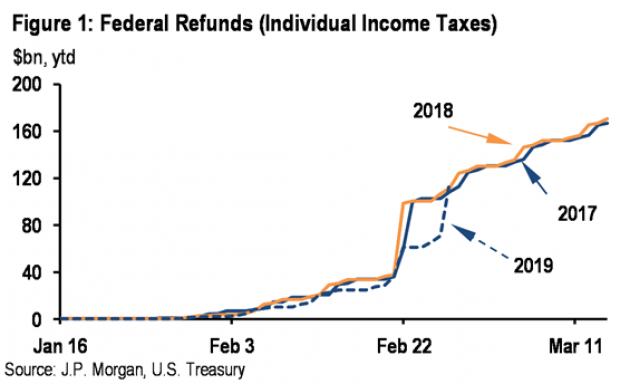
Smaller refunds in the first few weeks of the current tax season were shaping up to be a political problem for Republicans, but new data from the IRS shows that the value of refund checks has snapped back and is now running 1.3 percent higher than last year. The average refund through February 23 last year was $3,103, while the average refund through February 22 of 2019 was $3,143 – a difference of $40. The chart below from J.P. Morgan shows how refunds performed over the last 3 years.
Number of the Day: $22 Trillion
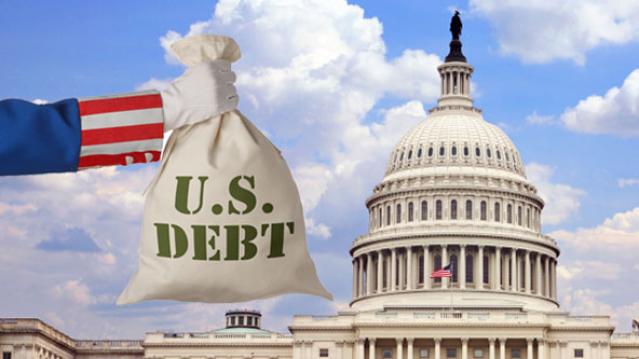
The total national debt surpassed $22 trillion on Monday. Total public debt outstanding reached $22,012,840,891,685.32, to be exact. That figure is up by more than $1.3 trillion over the past 12 months and by more than $2 trillion since President Trump took office.
Chart of the Week: The Soaring Cost of Insulin
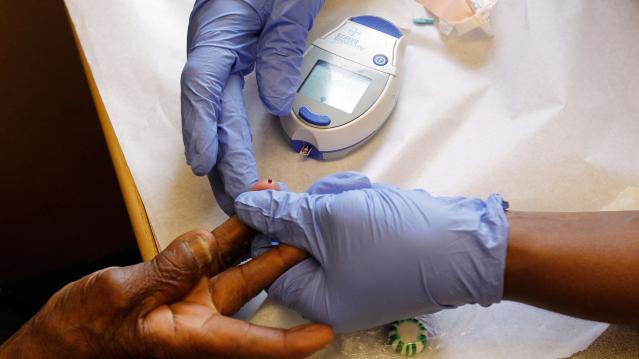
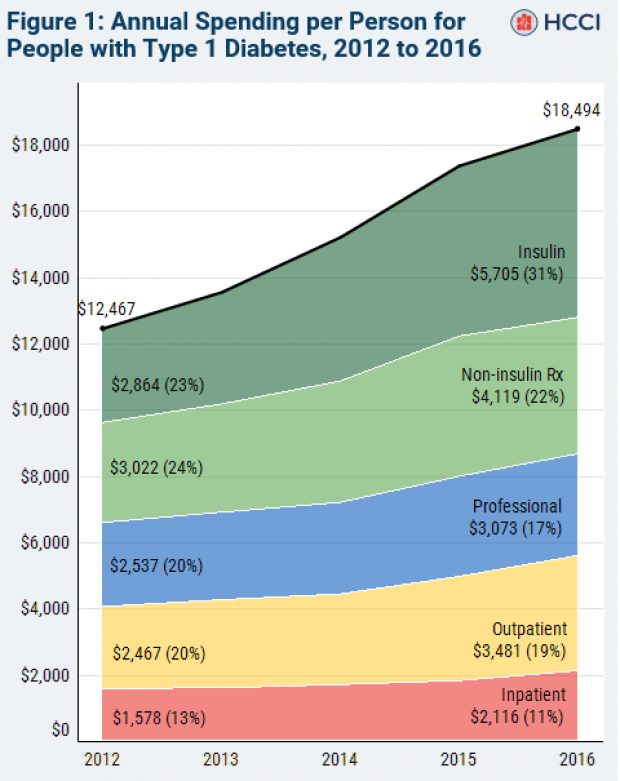
The cost of insulin used to treat Type 1 diabetes nearly doubled between 2012 and 2016, according to an analysis released this week by the Health Care Cost Institute. Researchers found that the average point-of-sale price increased “from $7.80 a day in 2012 to $15 a day in 2016 for someone using an average amount of insulin (60 units per day).” Annual spending per person on insulin rose from $2,864 to $5,705 over the five-year period. And by 2016, insulin costs accounted for nearly a third of all heath care spending for those with Type 1 diabetes (see the chart below), which rose from $12,467 in 2012 to $18,494.
Chart of the Day: Shutdown Hits Like a Hurricane

The partial government shutdown has hit the economy like a hurricane – and not just metaphorically. Analysts at the Committee for a Responsible Federal Budget said Tuesday that the shutdown has now cost the economy about $26 billion, close to the average cost of $27 billion per hurricane calculated by the Congressional Budget Office for storms striking the U.S. between 2000 and 2015. From an economic point of view, it’s basically “a self-imposed natural disaster,” CRFB said.
Chart of the Week: Lowering Medicare Drug Prices

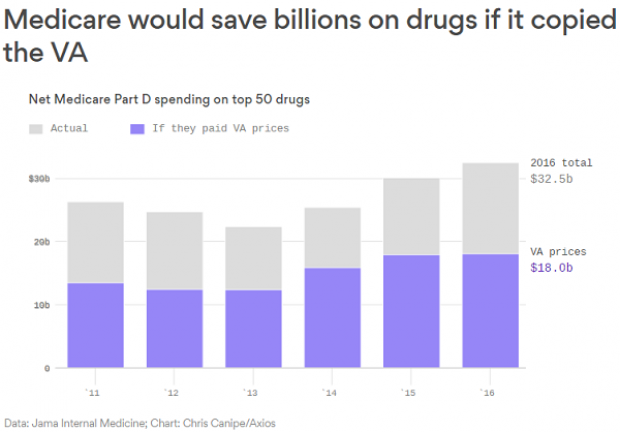
The U.S. could save billions of dollars a year if Medicare were empowered to negotiate drug prices directly with pharmaceutical companies, according to a paper published by JAMA Internal Medicine earlier this week. Researchers compared the prices of the top 50 oral drugs in Medicare Part D to the prices for the same drugs at the Department of Veterans Affairs, which negotiates its own prices and uses a national formulary. They found that Medicare’s total spending was much higher than it would have been with VA pricing.
In 2016, for example, Medicare Part D spent $32.5 billion on the top 50 drugs but would have spent $18 billion if VA prices were in effect – or roughly 45 percent less. And the savings would likely be larger still, Axios’s Bob Herman said, since the study did not consider high-cost injectable drugs such as insulin.

