This Man Just Lost $15 Billion in a Half Hour

In the history of sudden wealth loss, Li Hejun may have set a new record.
Li, who was China's richest man until this week, saw his fortune drop by as much as $15 billion in a half-hour as the stock in his company, Hanergy Thin Film Power Group, fell by nearly half. Trading in the shares was halted Wednesday and Li didn't attend the company's annual meeting.
While plenty of billionaires have seen their fortunes cut in half over time, few if any have seen $15 billion wiped out in a half-hour. Li's total fortune was around $30 billion before the stock plunged.
Prior to the drop, the company's shares had risen by more than fivefold since September, baffling analysts. Reuters reports that Hong Kong regulators are looking at alleged market manipulation with the stock.
Related: America’s Highest Paid CEO: It’s Not Who You Think
In a similar wealth decline, Hong Kong property and electronics magnate Pan Sutong has lost more than $11 billion this week as shares of two listed companies, Goldin Financial and Goldin Property, both closed down more than 40 percent.
Pan owns around 65 percent of Goldin Property and more than 70 percent of Goldin Financial, according to filings. His fortune was listed at more than $28 billion, making him Hong Kong's second-richest man.
That means that the two men have lost more in one day that the total net worth of Carl Icahn, Steve Ballmer or Michael Dell.
Pan is known for his large lifestyle. He's a big polo supporter and has sponsored a polo event in Britain attended by Princes William and Harry. He's said that the sport "is a way of life and belief in a sense of nobility."
Pan also owns vineyards around the world, including three in France and one in California's Napa Valley, called the Sloan Estate, which he purchased in 2011 for around $40 million.
This article originally appeared on CNBC
Read more from CNBC:
Playboy keeps it's clothes on
Kickstarter darling Pebble may be in a rough patch
McDonald's CEO: Ronald is here to stay
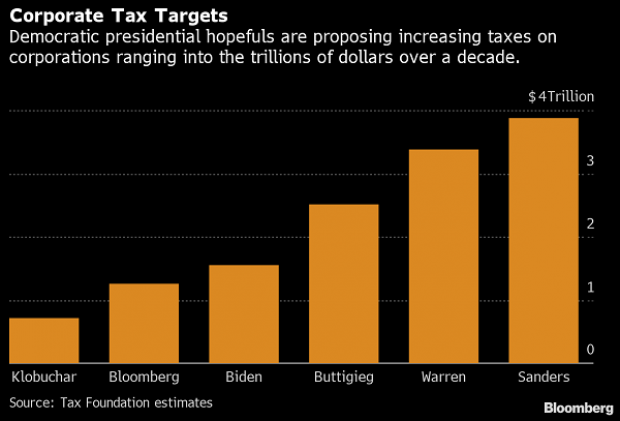
Chart of the Day: Boosting Corporate Tax Revenues
The leading candidates for the Democratic presidential nomination have all proposed increasing taxes on corporations, including raising income tax rates to levels ranging from 25% to 35%, up from the current 21% imposed by the Republican tax cuts in 2017. With Bernie Sanders leading the way at $3.9 trillion, here’s how much revenue the higher proposed corporate taxes, along with additional proposed surtaxes and reduced tax breaks, would generate over a decade, according to calculations by the right-leaning Tax Foundation, highlighted Wednesday by Bloomberg News.
Chart of the Day: Discretionary Spending Droops
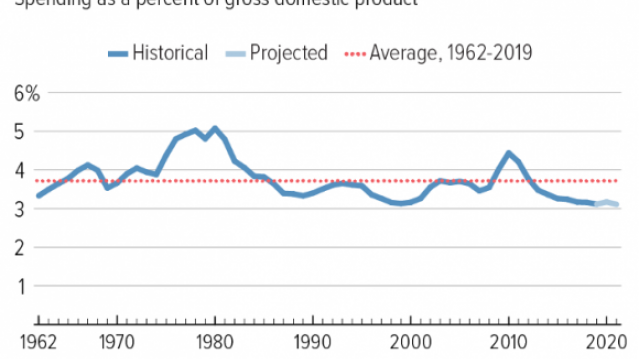
The federal government’s total non-defense discretionary spending – which covers everything from education and national parks to veterans’ medical care and low-income housing assistance – equals 3.2% of GDP in 2020, near historic lows going back to 1962, according to an analysis this week from the Center on Budget and Policy Priorities.
Chart of the Week: Trump Adds $4.7 Trillion in Debt
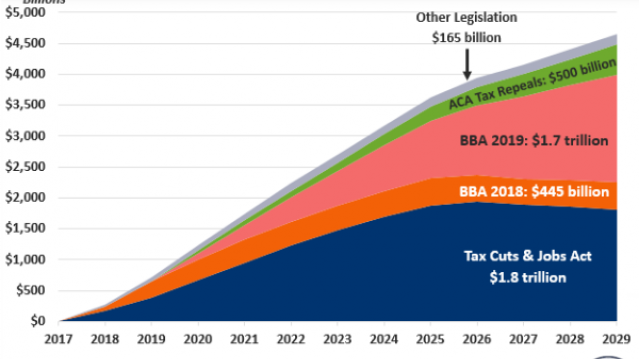
The Committee for a Responsible Federal Budget estimated this week that President Trump has now signed legislation that will add a total of $4.7 trillion to the national debt between 2017 and 2029. Tax cuts and spending increases account for similar portions of the projected increase, though if the individual tax cuts in the 2017 Republican overhaul are extended beyond their current expiration date at the end of 2025, they would add another $1 trillion in debt through 2029.
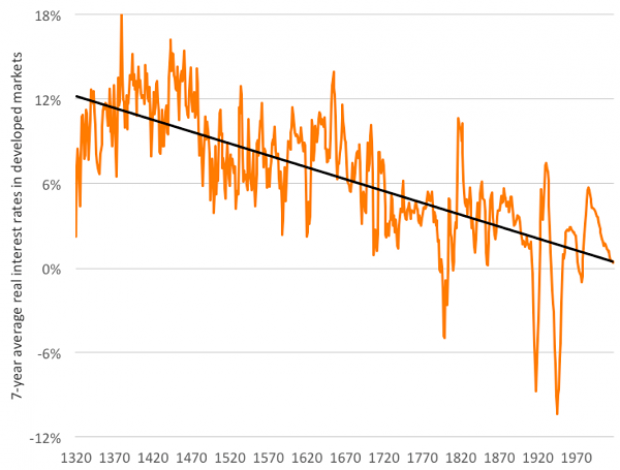
Chart of the Day: The Long Decline in Interest Rates
Are interest rates destined to move higher, increasing the cost of private and public debt? While many experts believe that higher rates are all but inevitable, historian Paul Schmelzing argues that today’s low-interest environment is consistent with a long-term trend stretching back 600 years.
The chart “shows a clear historical downtrend, with rates falling about 1% every 60 years to near zero today,” says Bloomberg’s Aaron Brown. “Rates do tend to revert to a mean, but that mean seems to be declining.”
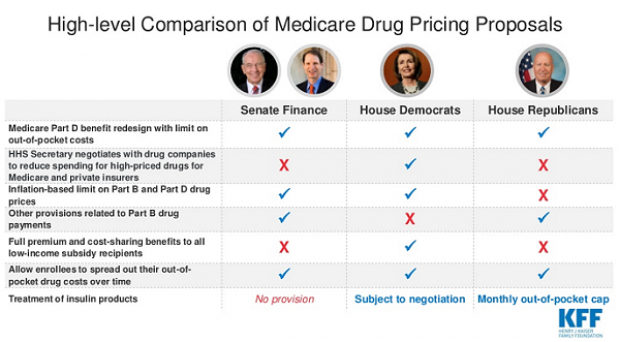
Chart of the Day: Drug Price Plans Compared
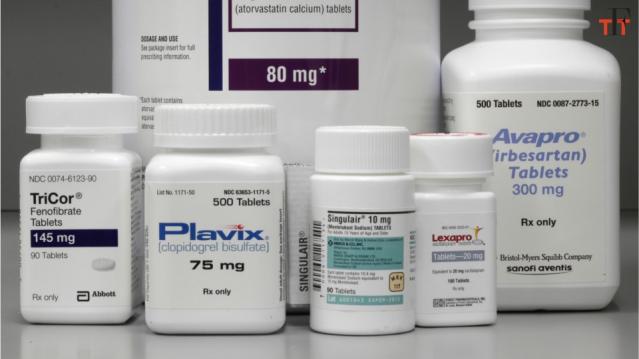
Lawmakers are considering three separate bills that are intended to reduce the cost of prescription drugs. Here’s an overview of the proposals, from a series of charts produced by the Kaiser Family Foundation this week. An interesting detail highlighted in another chart: 88% of voters – including 92% of Democrats and 85% of Republicans – want to give the government the power to negotiate prices with drug companies.

