Home Buying Gets Easier as Down Payments Dip

One hurdle to first-time homebuyers is starting to get a little lower: The average down payment for a home fell to less than 15 percent in the first quarter of 2015 to its lowest level since early 2012. The average down payment for the quarter was $57,710, according to RealtyTrac.
The lower down payments reflect new loan programs recently introduced by Fannie Mae and Freddie Mac, and lower insurance premiums for Federal Housing Authority Loans. The market is also adjusting as large, institutional investors who had been buying starter homes as rental investments dial back.
Related: U.S. Homeownership Dips, But Household Formation Rises
“Down payment trends in the first quarter indicate that first-time homebuyers are finally starting to come out of the woodwork, albeit gradually,” RealtyTrac vice president Daren Blomquist said in a statement.
Broken down by type of loan, the average down payment for conventional loans was 18.4 percent ($72,590), and the average down payment for FHA loans was just 2.9 percent ($7,609). FHA loans as a share of all mortgages increased from 21 percent in January to 25 percent in March.
Among the country’s largest counties, Wayne County in Detroit, Mich., had the lowest average down payment (12 percent), and New York had the highest (37 percent).
While lower down payments are good news for first-time homebuyers, they also are a reminder of practices that led to the housing bubble that began to burst in late 2006 and contributed to the financial crisis. During the height of the boom, buyers were able to purchase homes that they couldn’t really afford by putting little or no money down on the property.
Tax Refunds Rebound
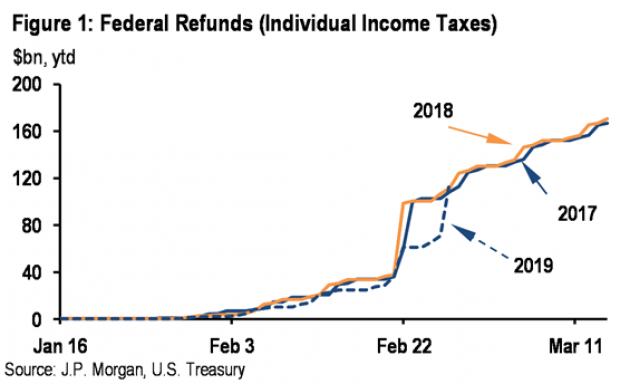
Smaller refunds in the first few weeks of the current tax season were shaping up to be a political problem for Republicans, but new data from the IRS shows that the value of refund checks has snapped back and is now running 1.3 percent higher than last year. The average refund through February 23 last year was $3,103, while the average refund through February 22 of 2019 was $3,143 – a difference of $40. The chart below from J.P. Morgan shows how refunds performed over the last 3 years.
Number of the Day: $22 Trillion
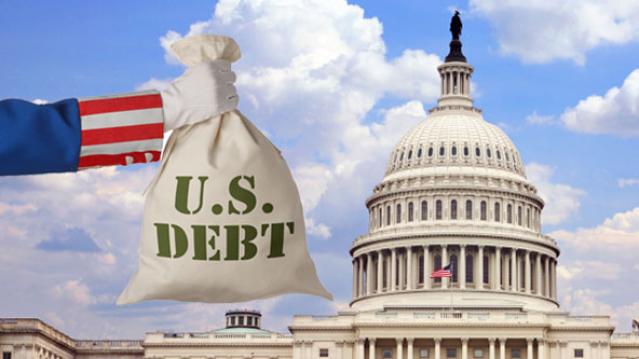
The total national debt surpassed $22 trillion on Monday. Total public debt outstanding reached $22,012,840,891,685.32, to be exact. That figure is up by more than $1.3 trillion over the past 12 months and by more than $2 trillion since President Trump took office.
Chart of the Week: The Soaring Cost of Insulin
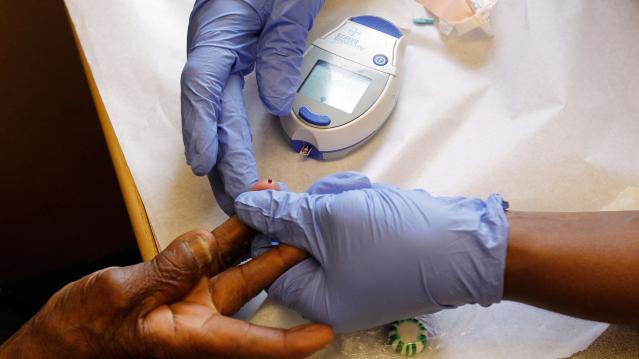
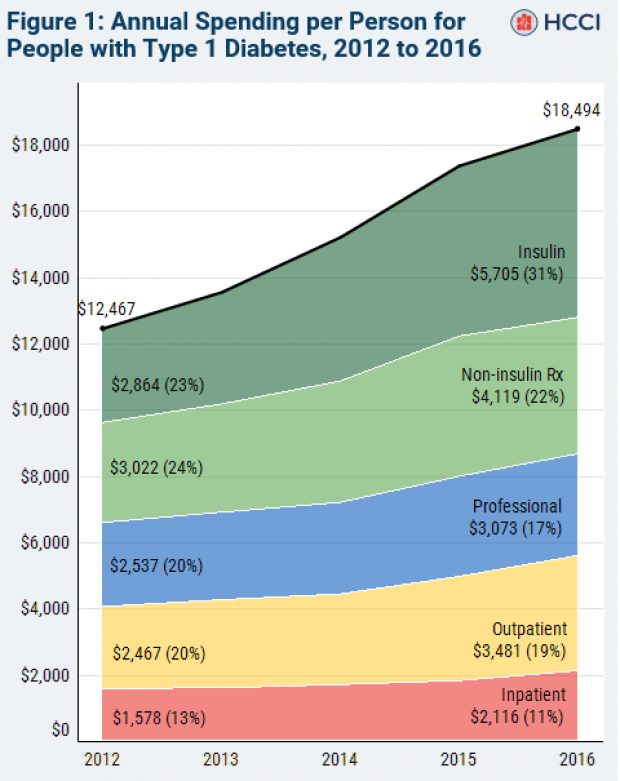
The cost of insulin used to treat Type 1 diabetes nearly doubled between 2012 and 2016, according to an analysis released this week by the Health Care Cost Institute. Researchers found that the average point-of-sale price increased “from $7.80 a day in 2012 to $15 a day in 2016 for someone using an average amount of insulin (60 units per day).” Annual spending per person on insulin rose from $2,864 to $5,705 over the five-year period. And by 2016, insulin costs accounted for nearly a third of all heath care spending for those with Type 1 diabetes (see the chart below), which rose from $12,467 in 2012 to $18,494.
Chart of the Day: Shutdown Hits Like a Hurricane

The partial government shutdown has hit the economy like a hurricane – and not just metaphorically. Analysts at the Committee for a Responsible Federal Budget said Tuesday that the shutdown has now cost the economy about $26 billion, close to the average cost of $27 billion per hurricane calculated by the Congressional Budget Office for storms striking the U.S. between 2000 and 2015. From an economic point of view, it’s basically “a self-imposed natural disaster,” CRFB said.
Chart of the Week: Lowering Medicare Drug Prices
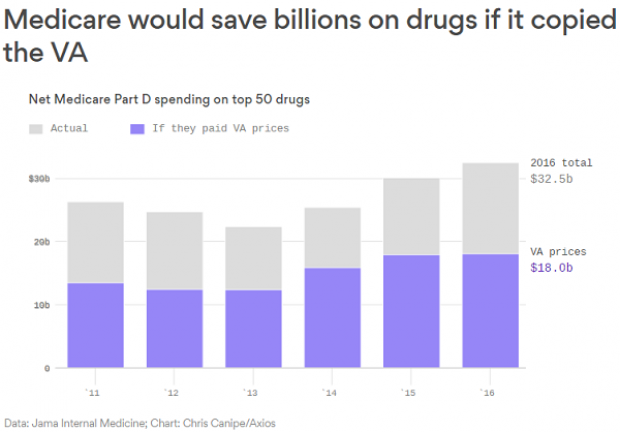
The U.S. could save billions of dollars a year if Medicare were empowered to negotiate drug prices directly with pharmaceutical companies, according to a paper published by JAMA Internal Medicine earlier this week. Researchers compared the prices of the top 50 oral drugs in Medicare Part D to the prices for the same drugs at the Department of Veterans Affairs, which negotiates its own prices and uses a national formulary. They found that Medicare’s total spending was much higher than it would have been with VA pricing.
In 2016, for example, Medicare Part D spent $32.5 billion on the top 50 drugs but would have spent $18 billion if VA prices were in effect – or roughly 45 percent less. And the savings would likely be larger still, Axios’s Bob Herman said, since the study did not consider high-cost injectable drugs such as insulin.

