It’s Not Just in Your Head, the Web Is Slowing Down

It’s not your imagination, and it’s not because AT&T — and possibly others — is purposefully cutting speeds to unlimited data plan users. The Internet is slowing down. The reason: Websites are growing in size, causing slower load times.
The average website is now 2.1 MB in size, compared to 1.5 MB two years ago, according to HTTP Archive, an Internet data measurement company. Multiple reasons can explain this increase in size.
Sites have been adding more content in an effort to drum up traffic, such as videos, engaging images, interactive plug-ins (comments and feeds) and other code and script-heavy features. Websites are becoming more and more technically advanced, and other sites have to keep adding features to stay competitive.
To keep up with the rapidly increasing number of users accessing sites on various platforms, developers are offering more versions of websites as well as apps to accommodate all devices, including smartphones, watches, tablets, and other gadgets. All of these versions require additional code, ultimately adding to the weight of a given website.
Then there are the advertisers who want to get the user’s attention by creating dramatic displays for their products that consume even more bandwidth.
Websites also want to know who is visiting their pages, both welcome and unwelcome visitors. New tools that track and analyze visitors have increased in popularity, as well as stronger encryption technology to add more security. These security measures and trackers require more code, again slowing load times.

Unfortunately for websites trying to keep up with the times, Google has just introduced a new ‘Slow to Load’ warning sign in mobile search results. Since mobile searches account for more than half of the total Google searches in 10 countries, Google wants to enhance user experience for those on their mobile platform.
Although the weight of a website isn’t all that contributes to slow loading, it’s a major factor. Other reasons include users overusing data, a poor connection, or a high level of traffic in the mobile network.
Google also changed its algorithm in April, so now ‘mobile friendly’ sites are ranked higher on search results, while those that fail to meet its criteria are ranked lower.
Although the internet is only slowing by a matter of seconds, it’s still slowing down. All the more reason for a user to become frustrated with a page that’s taking a couple extra seconds to load and go to a competitor’s site.
Chart of the Day: SALT in the GOP’s Wounds

The stark and growing divide between urban/suburban and rural districts was one big story in this year’s election results, with Democrats gaining seats in the House as a result of their success in suburban areas. The GOP tax law may have helped drive that trend, Yahoo Finance’s Brian Cheung notes.
The new tax law capped the amount of state and local tax deductions Americans can claim in their federal filings at $10,000. Congressional seats for nine of the top 25 districts where residents claim those SALT deductions were held by Republicans heading into Election Day. Six of the nine flipped to the Democrats in last week’s midterms.
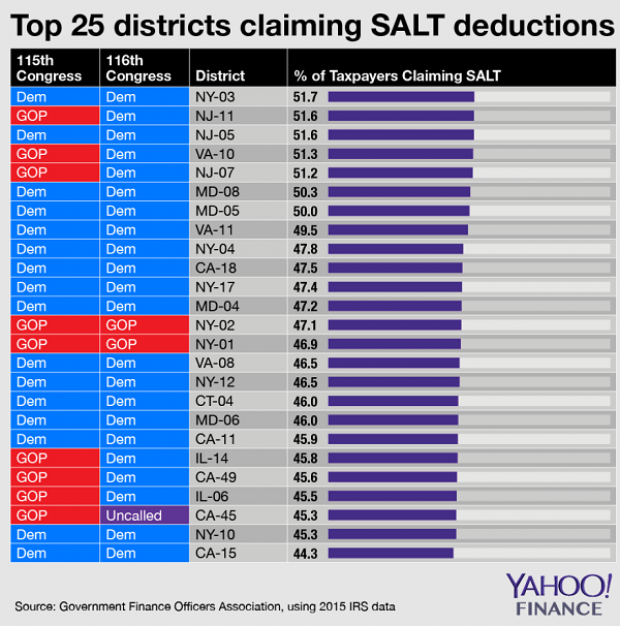
Chart of the Day: Big Pharma's Big Profits
Ten companies, including nine pharmaceutical giants, accounted for half of the health care industry's $50 billion in worldwide profits in the third quarter of 2018, according to an analysis by Axios’s Bob Herman. Drug companies generated 23 percent of the industry’s $636 billion in revenue — and 63 percent of the total profits. “Americans spend a lot more money on hospital and physician care than prescription drugs, but pharmaceutical companies pocket a lot more than other parts of the industry,” Herman writes.
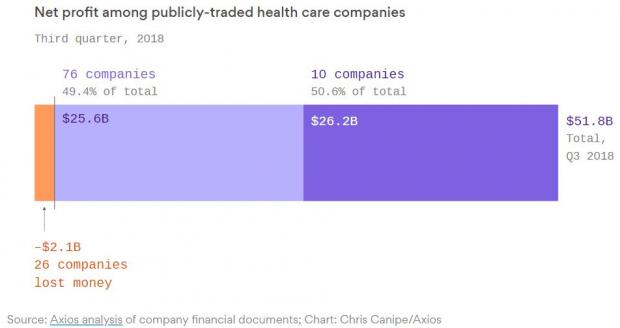
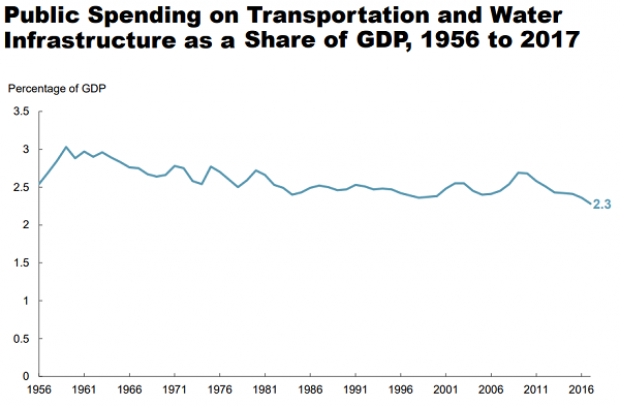
Chart of the Day: Infrastructure Spending Over 60 Years

Federal, state and local governments spent about $441 billion on infrastructure in 2017, with the money going toward highways, mass transit and rail, aviation, water transportation, water resources and water utilities. Measured as a percentage of GDP, total spending is a bit lower than it was 50 years ago. For more details, see this new report from the Congressional Budget Office.
Number of the Day: $3.3 Billion

The GOP tax cuts have provided a significant earnings boost for the big U.S. banks so far this year. Changes in the tax code “saved the nation’s six biggest banks $3.3 billion in the third quarter alone,” according to a Bloomberg report Thursday. The data is drawn from earnings reports from Bank of America, Citigroup, Goldman Sachs, JPMorgan Chase, Morgan Stanley and Wells Fargo.
Clarifying the Drop in Obamacare Premiums
We told you Thursday about the Trump administration’s announcement that average premiums for benchmark Obamacare plans will fall 1.5 percent next year, but analyst Charles Gaba says the story is a bit more complicated. According to Gaba’s calculations, average premiums for all individual health plans will rise next year by 3.1 percent.
The difference between the two figures is produced by two very different datasets. The Trump administration included only the second-lowest-cost Silver plans in 39 states in its analysis, while Gaba examined all individual plans sold in all 50 states.