Feeling Flush, More Parents Open Their Wallets for College Spending

As lingering financial fears from the recession fade, more parents are willing and able to open their wallets to pay for their children’s educations.
Parents have become the top source of college funding for the first time since 2010. According to a new report from private student loan lender Sallie Mae’s, parental income and savings covered 32 percent of college costs in the academic year 2014-15, while scholarships and grants covered 30 percent.
Families spent an average of $24,164 on college this year, a 16 percent rise in spending from the previous year and the largest increase since 2009-10. The money spent covers costs of tuition, books, and living expenses.
Related: Average Family Has Saved Enough to Send One Kid to College for Half a Year
The report details how fewer parents fear the worst when it comes to the risks associated with college. Fewer parents are worried that their child won’t find a job after graduation, that their income will decline because of layoffs, and that there will be an increase in student loan rates. As confidence has increased, fewer families are using cost-saving techniques, such as having students live at home.
Another factor contributing to the willingness of parents to spend on education is the improving stock market. The average size of a 529 account, the popular college savings investment plan, continues to grow after the recession caused a downturn, hitting a balance of $20,474 as of December 1, 2014. That figure tumbled to $10,690 at the end of 2008, according to data from the College Savings Plan Network.
Although parents may be feeling better about paying for college, the basic trend of increasing prices continues, and loans are still a big part of the funding picture. Between 2001 and 2012, average undergraduate tuition almost doubled, causing an average real rate increase of 3.5 percent each year. Nearly 71 percent of college graduates left school with student loan debt this year, up from 54 percent 20 years prior. The average debt was $35,000 in 2015, an increase of 34 percent from 2010, student loan-tracker Edvisors has found.
Will Parents Finally Get a Break on Back-to-School Spending This Year?
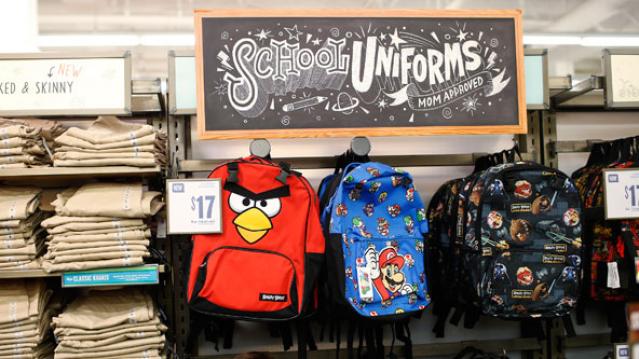
The average family with school-age children will spend $630 on clothing and school supplies before their kids return to the classroom.
That’s down slightly from the $669 spent last year, but represents a 42 percent increase over the past decade, according to the National Retail Federation.
Despite the lower per-family spending, fewer consumers say the economy has influenced their spending plans, and a smaller percentage are looking for sales or buying generic products to save.
Among those surveyed, 93 percent said they’d buy clothing for their kids, laying out an average $218 on new threads and $117 on new shoes. Spending on school supplies will average $98.
Families said they planned to spend an average of $197 on electronics, down from $212 spent in that category last year.
Related: 10 Sure Ways to Save on Back-to-School Shopping
A quarter of those surveyed said that they’d start back-to-school shopping just a week or two before school started, while one in five start shopping two months before school begins.
Discount stores represented the most popular destinations for online shopping (62 percent), followed by department stores (56 percent), and clothing stores (54 percent).
Parents are letting their kids take the lead on some purchases, with 86 percent of shoppers saying that their kids will influence at least a quarter of purchases. Teens will spend $33 of their own money an average, and pre-teens will pay $18 out of pocket.
Total spending on back-to-school shopping will amount to $25 billion for K-12, with another $43 billion spent on back-to-college shopping.
They’re Leaving Las Vegas: Fewer I Do’s in Last Decade

When it comes to destination weddings, Las Vegas has lost that loving feeling. The Las Vegas Sun reports that the wedding rate in Sin City has plummeted 37 percent in the past decade—nearly 47,000 fewer couples got married in 2014 than in 2004.
By comparison, 2004 was a boom year for weddings in Sin City. There were 128,000 weddings that year—including Britney Spears’ 55-hour marriage to Jason Allen Alexander at A Little White Wedding Chapel.

Related: Marriage?? Young Americans Aren’t Even Shacking Up
Who knows why gambling on love in Sin City has become a losing bet? Perhaps the dip reflects a national trend of millennials waiting to tie the knot or choosing to stay single. The marriage rate in the U.S. neared a record low in 2015 and is expected to drop further in 2016. Then there’s the expense. According to the TheKnot, the average wedding cost (excluding the honeymoon) is $31,213, with many couples looking for more unusual venues.
Clark County Clerk Lynn Goya, who took office in January, wants to change that trend in Vegas. The current fee for a marriage license in Las Vegas is $60, but Goya is asking for a $14 increase in the cost of wedding licenses to support marketing efforts targeting engaged couples. Last year 81,000 weddings happened in Las Vegas—and she’s hoping that wedding vow renewals and gay weddings will help boost those numbers even more. In New York, the legalization of gay marriage in 2011 led to an estimated $259 million in spending and $16 million in revenues for New York City.
Related: The $2.6 Billion Gay Wedding Boom
Then again it may be hard for Las Vegas to shake that quickie, drive-thru wedding image. Sin City has always had an illustrious history of celebrity weddings, with many more misses than hits: Cher’s nine-day union to rocker Gregg Allman in 1975, Mia Farrow and Frank Sinatra in 1966, Demi Moore and Bruce Willis in 1987, Richard Gere and Cindy Crawford in 1991, and Angelina Jolie and Billy Bob Thornton in 2000. On the bright side, there’s Paul Newman and Joanne Woodward’s marriage, which endured for 50 years, Jon Bon Jovi and his wife, Dorothea’s 1987 wedding day, and Kelly Ripa and Mark Consuelo’s union from 1996, which is still standing.
Expense Account Dining: More McDonald's Than 'Mad Men'
The 15 Most Popular Restaurants for Business Travelers
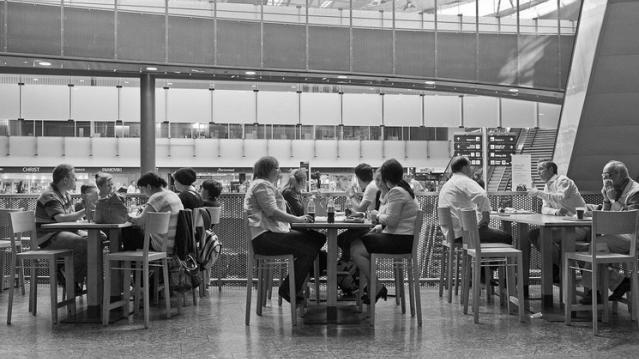
Road warriors know that business travel can be far from glamorous — a seemingly endless series of meetings broken up by long stretches behind the wheel or in cramped airplane seats. And despite the occasional great meal, expense account dining isn’t all it’s cracked up to be, either.
That’s made clear by a new quarterly report from Certify, which provides software for companies and employees to manage their expenses. The company used millions of receipts and vendor ratings from business people to compile rankings of the most commonly expensed restaurants and those with the highest ratings.
Unsurprisingly, Starbucks was the most commonly expensed restaurant, accounting for 4.7 percent of receipts submitted for reimbursement. McDonald’s and Subway were next on the list, with the burger chain the most common choice for dinners and the sandwich chain the top pick for lunches. Fast food chain Chick-fil-A received the top rating among restaurants, with a 4.5 average on a scale from 1 to 5. The days of the three Martini lunch are clearly long gone.
Related: 9 Ways McDonald’s Wants to Get You Excited About Its Food Again
Certify also reported that business travelers continue to increasingly choose Uber and Airbnb over taxis and hotels. Airbnb grew 143 percent in receipts in the second quarter of the year, though it remains far behind hotels like Marriott and Hampton Inn in popularity. Rental cars still dominated the group transportation receipts (45 percent), but Uber made up 31 percent of receipts, an increase of 8 percentage points from this time last year. For the first time ever, Uber was more popular than taxis, which made up 24 percent of receipts.

What Your Smartphone Knows That Your Mother Doesn’t
Can Your Smartphone Be Used to Detect Depression?
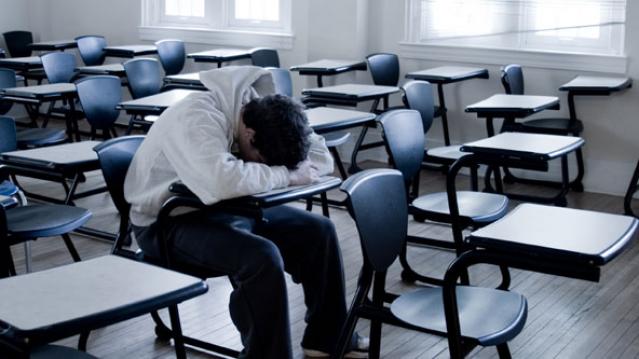
It’s always there, in your pocket or purse or on your desk, quietly collecting information. And apparently, when it comes to depression, there’s quite a lot your smartphone knows about you.
According to a small study from Northwestern Medicine, that data from your smartphone can predict with eerie 87 percent accuracy whether you’re suffering from depression or not.
The telling signs: You spend more time on your smartphone and less time leaving the house, and you visit very few places each day.
Related: Smartphone Notifications Are Killing Our Concentration
The researchers used Craigslist to find 40 test subjects between the ages of 19 and 58, and outfitted their smartphones with an app to monitor their location and usage. The individuals took a questionnaire that measured signs of depression; half of the subjects had troubling symptoms and half did not. Using GPS, the phones tracked the subjects’ movements and locations every five minutes. The subjects also were asked questions about their mood at different points during the day.
These factors were then correlated with the test subjects’ original depression test scores. And the results were uncanny. Depressed people used their phones more often and for longer periods of time —an average of 68 minutes a day. By comparison, the individuals who didn’t show signs of depression spent only 17 minutes on theirs. Researchers attributed the increased use of the phone to task avoidance, another symptom of depressed people.
Perhaps more significant than the findings of this small study — only 28 of the 40 subjects had enough data to be studied — is the potential the researchers felt that smartphones could play in future medical diagnosis.
When loaded up with the correct sensors, the smartphone can be used to detect a person’s emotional states, and monitor moods, without the user having to utter a word. It also has the ability to offer suggestions to reinforce positive behaviors when depression is detected. The results of the study were published in the Journal of Medical Internet Research yesterday, but one conclusion was becoming increasingly evident even before the report came out: Smartphones — and the sensors they now contain — just keep getting smarter.
Obamacare Plans Offer 34 Percent Fewer Choices

As many predicted, Americans insured under the Affordable Care Act may not be able to keep their doctors--and even their hospitals.
A new study reveals that the average plans provided on the Obamacare health insurance exchanges offer 34 percent fewer providers than the average commercial plan offered outside the exchange.
The analysis from Avalere shows the disparity compared with commercial plans:
- 42 percent fewer oncology and cardiology specialists
- 32 percent fewer mental health and primary care providers
- 24 percent fewer hospitals
Related: Top 10 Questions Consumers Ask About Obamacare

“Patients should evaluate a plan’s provider network when picking insurance on the exchange,” said Elizabeth Carpenter, vice president at Avalere. “Out-of-network care does not accrue toward out-of-pocket maximums, leaving consumers vulnerable to high costs if they seek care from a provider not included in their plan’s network.”
Patients need to evaluate a plan’s provider network when selecting insurance on the exchange, especially if they have a history of cancer or heart disease or require mental health services.
Limiting choice is one way for health exchanges to keep costs down, but ultimately patients bear the cost. “Plans continue to test new benefit designs in the exchange market,” said Dan Mendelson, CEO at Avalere. “Given the new requirements put in place by the ACA, network design is one way plans can drive value-based care and keep premiums low.”