When Buying Car Insurance, Young Drivers Should Stick with Mom and Dad

The parents of young drivers have enough to worry about, but a new study from insuranceQuotes.com finds that those who add coverage for an 18-to-24-year-old can expect to see an average annual premium increase of 80 percent on their existing car insurance. The good news: That’s still cheaper than if the young drivers bought insurance on their own. If those young drivers were to buy individual plans of their own, they’d pay 8 percent more on average — and in some cases, over 50 percent more — than their coverage costs on a parental plan.
Related: The Shocking Secret About How Your Car Insurance Rate Gets Set
Premiums can vary widely depending on the driver’s age and state. An 18-year-old can expect to pay an average of 18 percent more for an individual policy than he or she would if added to an existing policy. But in Rhode Island, an 18-year-old will pay an average of 53 percent more for an individual policy. In Connecticut and Oregon, the difference is 47 percent.
In states such as Arizona, Hawaii, and Illinois, it actually becomes cheaper, on average, for a young driver to get his or her own policy after turning 19. When it comes to determining premiums, Hawaii is the only state that doesn’t allow insurance providers to consider age, gender, or length of driving experience.
These are the five states with the greatest difference in premiums for young drivers buying their own coverage.
1. Rhode Island: 19 percent
2. Connecticut: 16 percent
3. North Carolina: 14 percent
4. Vermont: 14 percent
5. Maine: 14 percent
Related: Now 16-Year-Olds Can Double Your Car Insurance
And these five states have the smallest difference:
1. Hawaii: No difference
2. Illinois: No difference
3. Arizona: 2 percent
4. Mississippi: 5 percent
5. South Carolina: 5 percent.
Top Reads from The Fiscal Times:
- As Politicians Bicker Over Funding, Military Families Cut Back on Vacations
- Why We’re Wasting Billions on Teacher Development
- The Future of War Belongs to the Bots
Coming Soon: Deductible Relief Day!
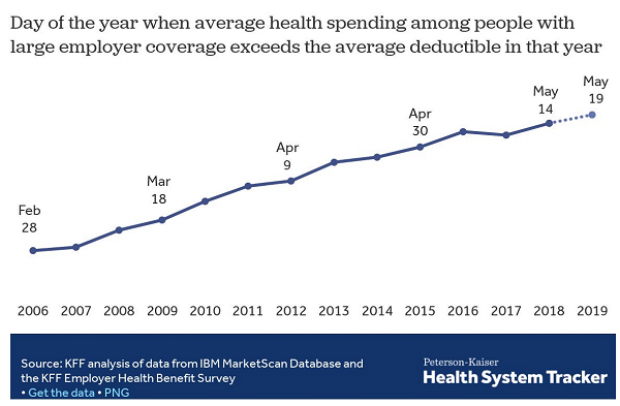
You may be familiar with the concept of Tax Freedom Day – the date on which you have earned enough to pay all of your taxes for the year. Focusing on a different kind of financial burden, analysts at the Kaiser Family Foundation have created Deductible Relief Day – the date on which people in employer-sponsored insurance plans have spent enough on health care to meet the average annual deductible.
Average deductibles have more than tripled over the last decade, forcing people to spend more out of pocket each year. As a result, Deductible Relief Day is “getting later and later in the year,” Kaiser’s Larry Levitt said in a tweet Thursday.
Chart of the Day: Families Still Struggling

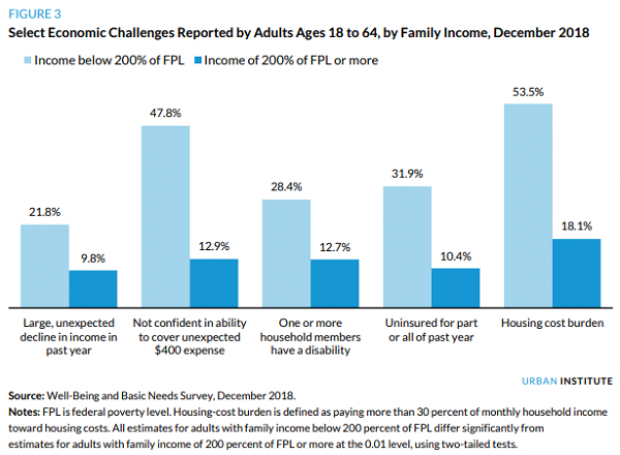
Ten years into what will soon be the longest economic expansion in U.S. history, 40% of families say they are still struggling, according to a new report from the Urban Institute. “Nearly 4 in 10 nonelderly adults reported that in 2018, their families experienced material hardship—defined as trouble paying or being unable to pay for housing, utilities, food, or medical care at some point during the year—which was not significantly different from the share reporting these difficulties for the previous year,” the report says. “Among adults in families with incomes below twice the federal poverty level (FPL), over 60 percent reported at least one type of material hardship in 2018.”
Chart of the Day: Pragmatism on a Public Option
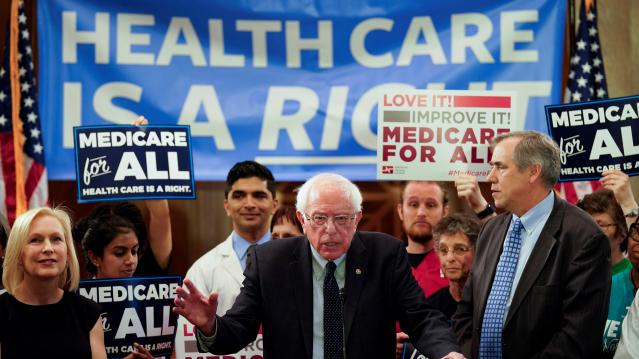
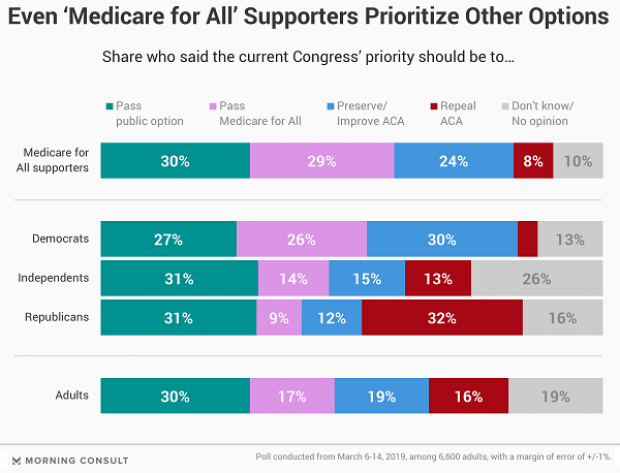
A recent Morning Consult poll 3,073 U.S. adults who say they support Medicare for All shows that they are just as likely to back a public option that would allow Americans to buy into Medicare or Medicaid without eliminating private health insurance. “The data suggests that, in spite of the fervor for expanding health coverage, a majority of Medicare for All supporters, like all Americans, are leaning into their pragmatism in response to the current political climate — one which has left many skeptical that Capitol Hill can jolt into action on an ambitious proposal like Medicare for All quickly enough to wrangle the soaring costs of health care,” Morning Consult said.
Chart of the Day: The Explosive Growth of the EITC

The Earned Income Tax Credit, a refundable tax credit for low- to moderate-income workers, was established in 1975, with nominal claims of about $1.2 billion ($5.6 billion in 2016 dollars) in its first year. According to the Tax Policy Center, by 2016 “the total was $66.7 billion, almost 12 times larger in real terms.”
Chart of the Day: The Big Picture on Health Care Costs

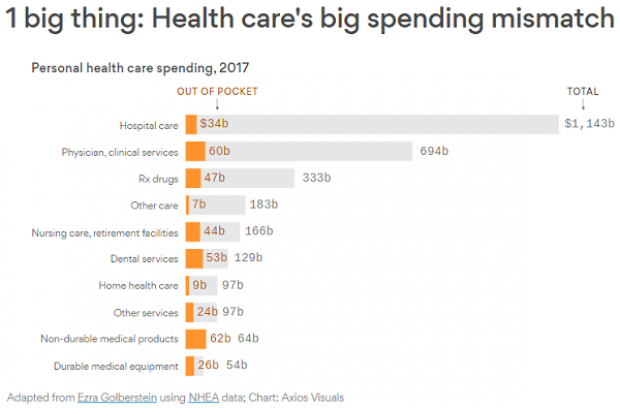
“The health care services that rack up the highest out-of-pocket costs for patients aren't the same ones that cost the most to the health care system overall,” says Axios’s Caitlin Owens. That may distort our view of how the system works and how best to fix it. For example, Americans spend more out-of-pocket on dental services ($53 billion) than they do on hospital care ($34 billion), but the latter is a much larger part of national health care spending as a whole.

