Obamacare Drives Uninsured Rate to Record Low
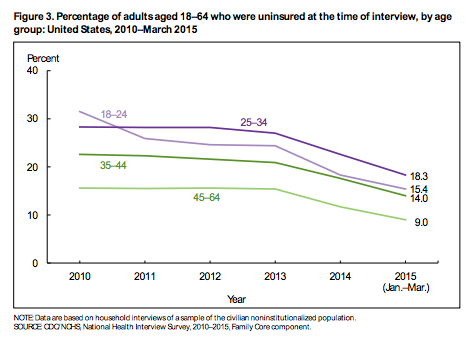
With the number of Americans lacking health insurance in decline, the rate of uninsured Americans has hit a record low, reaching levels not seen since the National Center for Disease Statistics began keeping records in 1972.
In the first quarter of 2015, 9.2 percent of all Americans were uninsured, according to new data from the Center for Disease Control and Prevention, down from 11.5 percent in 2014. The total number of uninsured Americans fell by 7 million over the past year, from 36 million in 2014 to 29 million in the first three months of 2015.
The largest declines were seen among adults who were poor or near-poor, suggesting that the Affordable Care Act was responsible for the most significant gains in coverage. Both groups dropped from uninsured rates near 50 percent in 2010 to 28 percent among poor adults and 23.8 percent among near-poor adults in 2015.
While Democrats are citing data as evidence that the Affordable Care Act is working, Republicans will likely argue that the reduction is being driven by an improving economy and a steadily declining unemployment rate.
Arkansas and Kentucky continue to record the most noticeable reductions in uninsured rates since Obamacare took effect at the beginning of 2013, according to a new report by Gallup. Texas is the only state to still have an uninsured rate higher than 20 percent.
Coming Soon: Deductible Relief Day!

You may be familiar with the concept of Tax Freedom Day – the date on which you have earned enough to pay all of your taxes for the year. Focusing on a different kind of financial burden, analysts at the Kaiser Family Foundation have created Deductible Relief Day – the date on which people in employer-sponsored insurance plans have spent enough on health care to meet the average annual deductible.
Average deductibles have more than tripled over the last decade, forcing people to spend more out of pocket each year. As a result, Deductible Relief Day is “getting later and later in the year,” Kaiser’s Larry Levitt said in a tweet Thursday.

Chart of the Day: Families Still Struggling

Ten years into what will soon be the longest economic expansion in U.S. history, 40% of families say they are still struggling, according to a new report from the Urban Institute. “Nearly 4 in 10 nonelderly adults reported that in 2018, their families experienced material hardship—defined as trouble paying or being unable to pay for housing, utilities, food, or medical care at some point during the year—which was not significantly different from the share reporting these difficulties for the previous year,” the report says. “Among adults in families with incomes below twice the federal poverty level (FPL), over 60 percent reported at least one type of material hardship in 2018.”

Chart of the Day: Pragmatism on a Public Option

A recent Morning Consult poll 3,073 U.S. adults who say they support Medicare for All shows that they are just as likely to back a public option that would allow Americans to buy into Medicare or Medicaid without eliminating private health insurance. “The data suggests that, in spite of the fervor for expanding health coverage, a majority of Medicare for All supporters, like all Americans, are leaning into their pragmatism in response to the current political climate — one which has left many skeptical that Capitol Hill can jolt into action on an ambitious proposal like Medicare for All quickly enough to wrangle the soaring costs of health care,” Morning Consult said.

Chart of the Day: The Explosive Growth of the EITC

The Earned Income Tax Credit, a refundable tax credit for low- to moderate-income workers, was established in 1975, with nominal claims of about $1.2 billion ($5.6 billion in 2016 dollars) in its first year. According to the Tax Policy Center, by 2016 “the total was $66.7 billion, almost 12 times larger in real terms.”

Chart of the Day: The Big Picture on Health Care Costs

“The health care services that rack up the highest out-of-pocket costs for patients aren't the same ones that cost the most to the health care system overall,” says Axios’s Caitlin Owens. That may distort our view of how the system works and how best to fix it. For example, Americans spend more out-of-pocket on dental services ($53 billion) than they do on hospital care ($34 billion), but the latter is a much larger part of national health care spending as a whole.
