A Red-Hot Tesla Burns Rubber on Consumer Reports
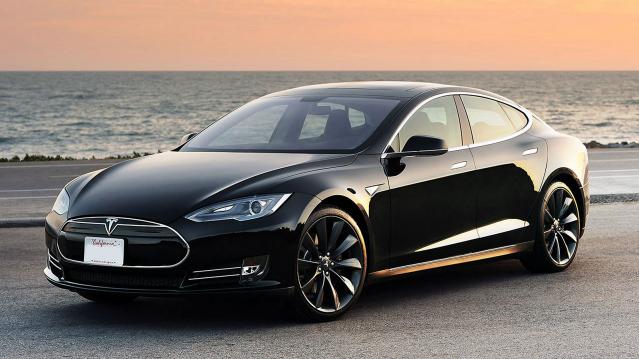
The Tesla Model S P85D sedan just broke the Consumer Reports rating system.
By definition, a car can’t exceed a score of 100 on the road test. But after the P85D racked up a score of 103, Consumer Reports was forced to create a new benchmark for the system and overhaul the ratings process according to a news release. The new system caused the car to slip to a score of 100.
A few characteristics of the car that allowed it to perform better in the test than any other car ever before include its rapid acceleration ability (0 to 60 mph in 3.5 seconds), its remarkable energy-efficiency (the car gets the equivalent of 87 miles per gallon) and its better breaking and handling system than the former top-scoring standard Model S. Two years ago, the base model version of the Model S received a 99 out of 100, which at the time was the highest rating ever for a vehicle.
Related: Why Americans Are Keeping Their Cars Longer Than Ever
The report is careful to note that even with a perfect score, the Tesla isn’t a perfect car. Besides a price tag of $127,820, beyond the means of the average person and the most expensive car Consumer Reports has ever reviewed, the car is louder than the base Model S and isn’t as plush as other luxury vehicles.
In addition, a long drive might be problematic if there aren’t any nearby charging stations along the route due to the vehicle’s 200-plus mile range. The rating also doesn’t account for the Tesla’s reliability, but the Model S comes with average reliability, according to owner-survey responses.
Imperfections aside, the car received an enviable final assessment. “It’s a remarkable car that paves a new, unorthodox course, and it’s a powerful statement of American startup ingenuity,” the report reads.
Coming Soon: Deductible Relief Day!

You may be familiar with the concept of Tax Freedom Day – the date on which you have earned enough to pay all of your taxes for the year. Focusing on a different kind of financial burden, analysts at the Kaiser Family Foundation have created Deductible Relief Day – the date on which people in employer-sponsored insurance plans have spent enough on health care to meet the average annual deductible.
Average deductibles have more than tripled over the last decade, forcing people to spend more out of pocket each year. As a result, Deductible Relief Day is “getting later and later in the year,” Kaiser’s Larry Levitt said in a tweet Thursday.

Chart of the Day: Families Still Struggling

Ten years into what will soon be the longest economic expansion in U.S. history, 40% of families say they are still struggling, according to a new report from the Urban Institute. “Nearly 4 in 10 nonelderly adults reported that in 2018, their families experienced material hardship—defined as trouble paying or being unable to pay for housing, utilities, food, or medical care at some point during the year—which was not significantly different from the share reporting these difficulties for the previous year,” the report says. “Among adults in families with incomes below twice the federal poverty level (FPL), over 60 percent reported at least one type of material hardship in 2018.”

Chart of the Day: Pragmatism on a Public Option

A recent Morning Consult poll 3,073 U.S. adults who say they support Medicare for All shows that they are just as likely to back a public option that would allow Americans to buy into Medicare or Medicaid without eliminating private health insurance. “The data suggests that, in spite of the fervor for expanding health coverage, a majority of Medicare for All supporters, like all Americans, are leaning into their pragmatism in response to the current political climate — one which has left many skeptical that Capitol Hill can jolt into action on an ambitious proposal like Medicare for All quickly enough to wrangle the soaring costs of health care,” Morning Consult said.

Chart of the Day: The Explosive Growth of the EITC

The Earned Income Tax Credit, a refundable tax credit for low- to moderate-income workers, was established in 1975, with nominal claims of about $1.2 billion ($5.6 billion in 2016 dollars) in its first year. According to the Tax Policy Center, by 2016 “the total was $66.7 billion, almost 12 times larger in real terms.”

Chart of the Day: The Big Picture on Health Care Costs

“The health care services that rack up the highest out-of-pocket costs for patients aren't the same ones that cost the most to the health care system overall,” says Axios’s Caitlin Owens. That may distort our view of how the system works and how best to fix it. For example, Americans spend more out-of-pocket on dental services ($53 billion) than they do on hospital care ($34 billion), but the latter is a much larger part of national health care spending as a whole.
