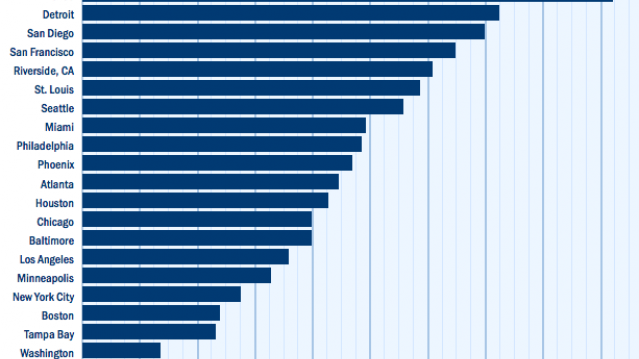
The Top 10 Cities Where Small-Biz Jobs Are Growing
 Dallas, TX")
Small businesses have been hiring, though at a slower rate than this time last year, according to the Paychex|IHS job index.
For the 11th month in a row, Dallas’s small businesses have shown the most employment gains. The city boasts the top 12-month growth rate at 1.38 percent. Detroit (1.35 percent), San Diego (1.27 percent), Baltimore and St. Louis (both 1.13 percent) round out the top five. Houston’s recent performance is also impressive, with a rebound in growth rates over the past three months compared with declines during the rest of the year.
Related: This Is the Best Time Since the Recession to Get a Small Business Loan
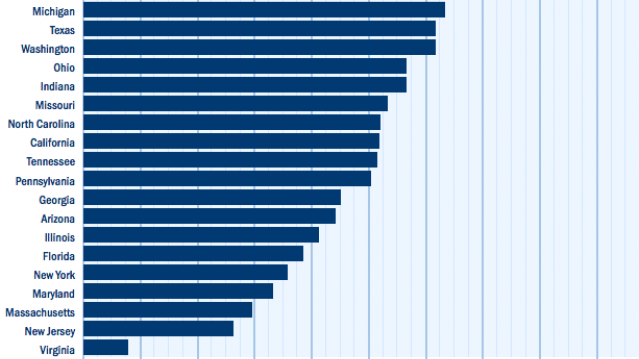
Only five states saw positive gains in employment rates over the past year, and none of them increased by a full statistical point. One notable state is Michigan, which ranks second behind Wisconsin, as the state with the highest employment gains in small businesses since 2004. It also came in second for highest gains in the past year.
The index numbers used by Paychex for cities and states is based on the current small business employment rate as compared with 2004. Paychex uses 2004 as the base period to compare current gains against because it was a year of expansion for small businesses. Below 100, and the rate is lower than in 2004. Above 100, and the rate is higher than in 2004.
The charts below rank the cities and states based on their index levels.
Top Reads from The Fiscal Times
- Why McDonald’s could Suddenly Be Responsible for Millions of New Employees
- The 10 Worst States for Property Taxes
- U.S. Companies Are Dying Faster than Ever
Tax Refunds Rebound

Smaller refunds in the first few weeks of the current tax season were shaping up to be a political problem for Republicans, but new data from the IRS shows that the value of refund checks has snapped back and is now running 1.3 percent higher than last year. The average refund through February 23 last year was $3,103, while the average refund through February 22 of 2019 was $3,143 – a difference of $40. The chart below from J.P. Morgan shows how refunds performed over the last 3 years.

Number of the Day: $22 Trillion

The total national debt surpassed $22 trillion on Monday. Total public debt outstanding reached $22,012,840,891,685.32, to be exact. That figure is up by more than $1.3 trillion over the past 12 months and by more than $2 trillion since President Trump took office.
Chart of the Week: The Soaring Cost of Insulin

The cost of insulin used to treat Type 1 diabetes nearly doubled between 2012 and 2016, according to an analysis released this week by the Health Care Cost Institute. Researchers found that the average point-of-sale price increased “from $7.80 a day in 2012 to $15 a day in 2016 for someone using an average amount of insulin (60 units per day).” Annual spending per person on insulin rose from $2,864 to $5,705 over the five-year period. And by 2016, insulin costs accounted for nearly a third of all heath care spending for those with Type 1 diabetes (see the chart below), which rose from $12,467 in 2012 to $18,494.

Chart of the Day: Shutdown Hits Like a Hurricane

The partial government shutdown has hit the economy like a hurricane – and not just metaphorically. Analysts at the Committee for a Responsible Federal Budget said Tuesday that the shutdown has now cost the economy about $26 billion, close to the average cost of $27 billion per hurricane calculated by the Congressional Budget Office for storms striking the U.S. between 2000 and 2015. From an economic point of view, it’s basically “a self-imposed natural disaster,” CRFB said.

Chart of the Week: Lowering Medicare Drug Prices

The U.S. could save billions of dollars a year if Medicare were empowered to negotiate drug prices directly with pharmaceutical companies, according to a paper published by JAMA Internal Medicine earlier this week. Researchers compared the prices of the top 50 oral drugs in Medicare Part D to the prices for the same drugs at the Department of Veterans Affairs, which negotiates its own prices and uses a national formulary. They found that Medicare’s total spending was much higher than it would have been with VA pricing.
In 2016, for example, Medicare Part D spent $32.5 billion on the top 50 drugs but would have spent $18 billion if VA prices were in effect – or roughly 45 percent less. And the savings would likely be larger still, Axios’s Bob Herman said, since the study did not consider high-cost injectable drugs such as insulin.
