Automakers Are Having a Record Year, but Here’s a Trend that Should Worry Them

U.S. auto sales closed out the summer on a positive note, topping estimates and casting some rosy light on the health of the American consumer. Recording its best August since 2003, the auto industry is on pace to sell 17.8 vehicles in 2015, well ahead of expectations of 17.3 million. If the numbers hold up, 2015 will be the best year ever for U.S. auto sales, beating the 17.4 million mark set in 2000.
The general consensus is that auto industry is in pretty good shape these days. Gas prices and interest rates are low, boosting the market for cars and light trucks. More than 2 million jobs were added to the U.S. economy in the past year, and more jobs is usually good news for auto sales. The unemployment rate has been trending lower for five years, sitting at a relatively healthy 5.3 percent in July.
Related: What's Next for Oil Prices? Look Out Below!
As with any statistic, though, there’s more than one way to look at the situation. Sure, auto sales are climbing as the economy gets stronger and more Americans hit their local car dealers’ lots. At least to some degree, though, higher auto sales should be expected just as a result of U.S. population growth. And those rising monthly sales figures are masking a continuing trend that is more worrisome for the auto industry: per capita auto sales are still in a long-term decline, even including the solid growth the industry has seen since the end of the recession. Doug Short at Advisor Perspectives did the math and made a graph:

According to Short’s analysis, the peak year for per capita auto sales in the U.S. was 1978. As the red line in the graph shows, the trend is negative since then.
In the graph, per capita auto sales in January, 1976, were defined as 100; the readings in the index since then are relative to that 1976 sales level. As you can see, the index moves higher until August of 1978, when per capita auto sales were up nearly 20 percent over 1976. Since then, per capita auto sales have fallen, reaching a low in 2009 that was nearly 50 percent lower than 1976. Since 2009, per capita auto sales have risen nicely, but are still more than 15 percent below peak.
What could explain the negative trend? Two factors come to mind. First, demographics. It has been widely reported that the millennial generation is less interested in owning cars for a variety of reasons, ranging from a weak economy to a cultural shift away from suburban life. However, the data on millennial car purchases is ambiguous; recently, millennials have started buying cars in volumes that look a lot like their elders. And even if millennials are less interested in buying cars, their preferences can’t explain a shift that began in the 1970s, before they were born.
Related: U.S. Companies Are Dying Faster Than Ever
The other factor that may explain the trend is income inequality. A study of car ownership by the Carnegie Foundation found that countries with higher income inequality have fewer cars per capita. The logic is simple: As more income is claimed by the wealthy, there’s less to go around for everyone else. And that means there’s less money for middle and lower income groups to buy and maintain automobiles, among other things.
Here’s a chart of the Gini index for the U.S. since 1947. (The Gini Index is a widely-used measure of income inequality. A higher Gini number means higher inequality.) Note that the Gini reading started climbing in the late ‘70s – the same time when per capita car ownership in the U.S. began to fall.
This chart tells us, not for the first time, that the U.S. has experienced more income inequality since the 1970s. Combined with the per capita auto sales data above, it suggests that as the rich have gotten richer and everyone else has struggled to keep up, car ownership has suffered. Although this is by no means proof of the relationship between income inequality and per capita car ownership over the last 40 years, it hints at an interesting theory – and suggests that the auto industry has good reason to be concerned about growing inequality in the U.S.

Top Reads From The Fiscal Times:
- 6 Reasons Gas Prices Could Fall Below $2 a Gallon
- Hoping for a Raise? Here’s How Much Most People Are Getting
- What the U.S. Must Do to Avoid Another Financial Crisis
Quote of the Day: A Big Hurdle for the Tax Cuts

“He goes in and campaigns on an issue, and the challenge is he then talks about executing drug dealers. Why do you think the press is going to cover the tax cuts if you’ve given them the much more exciting issue?”
-- Grover Norquist, president of tax-cutting advocacy group Americans for Tax Reform, on President Trump’s failure to sell the tax law.
The Obamacare Mandate That Could Produce $12 Billion in Fines in 2018
Republicans effectively eliminated the individual Obamacare mandate in the tax package signed late last year. Although the new regulation reducing the mandate penalty to zero doesn’t take effect until 2019, President Trump has cited the rule change as a victory over the health law so many conservatives oppose. “Essentially, we are getting rid of Obamacare. Some people would say, essentially, we have gotten rid of it," Trump told a crowd in Michigan two weeks ago.
However, many parts of the Affordable Care Act are still in effect and will continue to operate even after the individual mandate is eliminated in 2019.
In particular, the employer mandate, which requires companies with more than 50 employees to offer health benefits or face fine of roughly $2,000 per worker, will continue to play a significant role in the Obamacare system. The Congressional Budget Office estimates that the mandate will produce more than $12 billion in fines in 2018 alone.
Some conservative groups are pushing lawmakers to stop enforcing the employer mandate, but the IRS is still working to enforce the law. According to The New York Times Monday, the IRS is sending out notices to more than 30,000 businesses that have failed to comply.
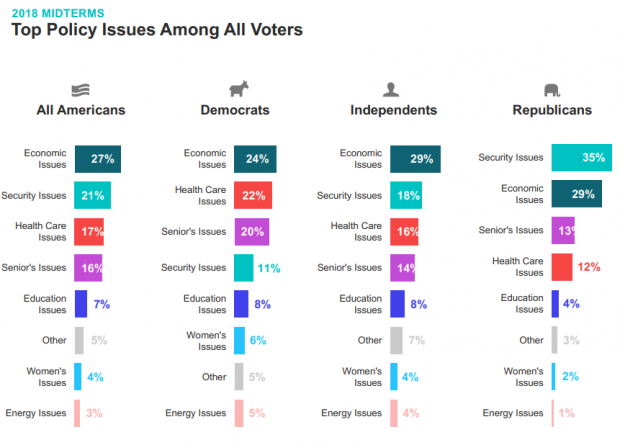
Chart of the Day: It’s Still the Economy, Stupid

Security may be the top policy issue for Republican voters, but the economy is the top concern for Democrats, independents and voters overall, according to Morning Consult’s latest polling on the midterm elections. Health care is third on the list, followed by “seniors’ issues.” The results are based on surveys with more than 275,000 registered U.S. voters from February 1 to April 30.
Number of the Day: $13 Billion
An analysis by Bloomberg finds that the roughly 180 companies in the S&P 500 that have reported earnings for the first three months of the year saved almost $13 billion thanks to the corporate tax cut enacted late last year. Those companies’ effective tax rate dropped by more than 6 percentage points on average. About a third of the tax savings went to 44 financial firms.
How a Florida Doctor with Social Ties to Trump Delayed a $16B Billion VA Project

A West Palm Beach doctor who is friends with Ike Perlmutter, the chairman of Marvel Entertainment and an informal adviser to President Trump on veterans’ issues, has held up “the biggest health information technology project in history — the transformation of the VA’s digital records system,” Politico’s Arthur Allen reports. Dr. Bruce Moskowitz “objected to the $16 billion Department of Veterans Affairs project because he doesn’t like the Cerner Corp. software he uses at two Florida hospitals, according to four former and current senior VA officials. Cerner technology is a cornerstone of the VA project. … Moskowitz’s concerns effectively delayed the agreement for months, the sources said.” Read the full story.