Automakers Are Having a Record Year, but Here’s a Trend that Should Worry Them

U.S. auto sales closed out the summer on a positive note, topping estimates and casting some rosy light on the health of the American consumer. Recording its best August since 2003, the auto industry is on pace to sell 17.8 vehicles in 2015, well ahead of expectations of 17.3 million. If the numbers hold up, 2015 will be the best year ever for U.S. auto sales, beating the 17.4 million mark set in 2000.
The general consensus is that auto industry is in pretty good shape these days. Gas prices and interest rates are low, boosting the market for cars and light trucks. More than 2 million jobs were added to the U.S. economy in the past year, and more jobs is usually good news for auto sales. The unemployment rate has been trending lower for five years, sitting at a relatively healthy 5.3 percent in July.
Related: What's Next for Oil Prices? Look Out Below!
As with any statistic, though, there’s more than one way to look at the situation. Sure, auto sales are climbing as the economy gets stronger and more Americans hit their local car dealers’ lots. At least to some degree, though, higher auto sales should be expected just as a result of U.S. population growth. And those rising monthly sales figures are masking a continuing trend that is more worrisome for the auto industry: per capita auto sales are still in a long-term decline, even including the solid growth the industry has seen since the end of the recession. Doug Short at Advisor Perspectives did the math and made a graph:

According to Short’s analysis, the peak year for per capita auto sales in the U.S. was 1978. As the red line in the graph shows, the trend is negative since then.
In the graph, per capita auto sales in January, 1976, were defined as 100; the readings in the index since then are relative to that 1976 sales level. As you can see, the index moves higher until August of 1978, when per capita auto sales were up nearly 20 percent over 1976. Since then, per capita auto sales have fallen, reaching a low in 2009 that was nearly 50 percent lower than 1976. Since 2009, per capita auto sales have risen nicely, but are still more than 15 percent below peak.
What could explain the negative trend? Two factors come to mind. First, demographics. It has been widely reported that the millennial generation is less interested in owning cars for a variety of reasons, ranging from a weak economy to a cultural shift away from suburban life. However, the data on millennial car purchases is ambiguous; recently, millennials have started buying cars in volumes that look a lot like their elders. And even if millennials are less interested in buying cars, their preferences can’t explain a shift that began in the 1970s, before they were born.
Related: U.S. Companies Are Dying Faster Than Ever
The other factor that may explain the trend is income inequality. A study of car ownership by the Carnegie Foundation found that countries with higher income inequality have fewer cars per capita. The logic is simple: As more income is claimed by the wealthy, there’s less to go around for everyone else. And that means there’s less money for middle and lower income groups to buy and maintain automobiles, among other things.
Here’s a chart of the Gini index for the U.S. since 1947. (The Gini Index is a widely-used measure of income inequality. A higher Gini number means higher inequality.) Note that the Gini reading started climbing in the late ‘70s – the same time when per capita car ownership in the U.S. began to fall.
This chart tells us, not for the first time, that the U.S. has experienced more income inequality since the 1970s. Combined with the per capita auto sales data above, it suggests that as the rich have gotten richer and everyone else has struggled to keep up, car ownership has suffered. Although this is by no means proof of the relationship between income inequality and per capita car ownership over the last 40 years, it hints at an interesting theory – and suggests that the auto industry has good reason to be concerned about growing inequality in the U.S.

Top Reads From The Fiscal Times:
- 6 Reasons Gas Prices Could Fall Below $2 a Gallon
- Hoping for a Raise? Here’s How Much Most People Are Getting
- What the U.S. Must Do to Avoid Another Financial Crisis
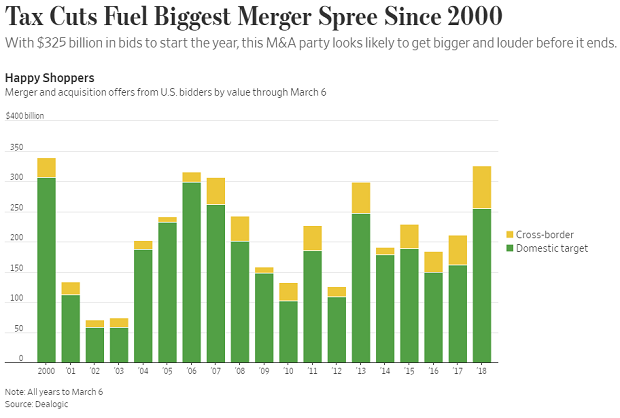
Chart of the Day: A Buying Binge Driven by Tax Cuts
The Wall Street Journal reports that the tax cuts and economic environment are prompting U.S. companies to go on a buying binge: “Mergers and acquisitions announced by U.S. acquirers so far in 2018 are running at the highest dollar volume since the first two months of 2000, according to Dealogic. Thomson Reuters, which publishes slightly different numbers, puts it at the highest since the start of 2007.”
Number of the Day: 5.5 Percent

Health care spending in the U.S. will grow at an average annual rate of 5.5 percent from 2017 through 2026, according to new estimates published in Health Affairs by the Office of the Actuary at the Centers for Medicare and Medicaid Services (CMS).
The projections mean that health care spending would rise as a share of the economy from 17.9 percent in 2016 to 19.7 percent in 2026.
Trump Clearly Has No Problem with Debt and Deficits

A self-proclaimed “king of debt,” President Trump has produced a budget that promises red ink as far as the eye can see. With last year's $1.5 trillion tax cut reducing revenues, the White House gave up even trying to pretend that its budget would balance anytime soon, and even the rosy economic projections contained in the budget couldn’t produce enough revenues, however fanciful, to cover the shortfall.
The Trump budget spends as much over 10 years as any budget produced by President Barack Obama, according to Jim Tankersley of The New York Times. And it projects total deficits of more than $7 trillion over the next decade — "a number that could double if the administration turns out to be overestimating economic growth and if the $3 trillion in spending cuts the White House has floated do not materialize in Congress,” Tankersley says.
Trump — who once promised to both balance the budget and pay down the national debt — isn’t the only one throwing off the shackles of fiscal restraint. Republicans as a whole appear to be embracing a new set of economic preferences defined by lower taxes and higher spending, in what Bloomberg describes as a “striking turnabout” in attitudes toward deficits and the national debt.
But some conservatives tell Tankersley that the GOP's core beliefs on spending and debt remain intact — and that spending on Social Security and Medicare, the primary drivers of the national debt, are all that matters when it comes to implementing fiscal restraint.
“They know that right now, a fundamental reform of entitlements won’t happen," John H. Cochrane, an economist at Stanford University’s Hoover Institution, tells Tankersley. "So, they have avoided weekly chaos and gotten needed military spending through by opening the spending bill, and they got an important reduction in growth-distorting marginal corporate rates through by accepting a bit more deficits. They know that can’t be the end of the story.”
Democrats, of course, have warned that the next chapter in the tale will involve big cuts to Social Security and Medicare. Even before we get there, though, Tankersley questions whether the GOP approach stands up to scrutiny: "This is a bit like saying, only regular exercise will keep America from having a fatal heart attack, so, you know, it's ok to eat a few more hamburgers now."
Part of the Shutdown-Ending Deal: $31 Billion More in Tax Cuts

Margot Sanger-Katz and Jim Tankersley in The New York Times: “The deal struck by Democrats and Republicans on Monday to end a brief government shutdown contains $31 billion in tax cuts, including a temporary delay in implementing three health care-related taxes.”
“Those delays, which enjoy varying degrees of bipartisan support, are not offset by any spending cuts or tax increases, and thus will add to a federal budget deficit that is already projected to increase rapidly as last year’s mammoth new tax law takes effect.”
IRS Paid $20 Million to Collect $6.7 Million in Tax Debts

Congress passed a law in 2015 requiring the IRS to use private debt collection agencies to pursue “inactive tax receivables,” but the financial results are not encouraging so far, according to a new taxpayer advocate report out Wednesday.
In fiscal year 2017, the IRS received $6.7 million from taxpayers whose debts were assigned to private collection agencies, but the agencies were paid $20 million – “three times the amount collected,” the report helpfully points out.
Like what you're reading? Sign up for our free newsletter.