Automakers Are Having a Record Year, but Here’s a Trend that Should Worry Them

U.S. auto sales closed out the summer on a positive note, topping estimates and casting some rosy light on the health of the American consumer. Recording its best August since 2003, the auto industry is on pace to sell 17.8 vehicles in 2015, well ahead of expectations of 17.3 million. If the numbers hold up, 2015 will be the best year ever for U.S. auto sales, beating the 17.4 million mark set in 2000.
The general consensus is that auto industry is in pretty good shape these days. Gas prices and interest rates are low, boosting the market for cars and light trucks. More than 2 million jobs were added to the U.S. economy in the past year, and more jobs is usually good news for auto sales. The unemployment rate has been trending lower for five years, sitting at a relatively healthy 5.3 percent in July.
Related: What's Next for Oil Prices? Look Out Below!
As with any statistic, though, there’s more than one way to look at the situation. Sure, auto sales are climbing as the economy gets stronger and more Americans hit their local car dealers’ lots. At least to some degree, though, higher auto sales should be expected just as a result of U.S. population growth. And those rising monthly sales figures are masking a continuing trend that is more worrisome for the auto industry: per capita auto sales are still in a long-term decline, even including the solid growth the industry has seen since the end of the recession. Doug Short at Advisor Perspectives did the math and made a graph:

According to Short’s analysis, the peak year for per capita auto sales in the U.S. was 1978. As the red line in the graph shows, the trend is negative since then.
In the graph, per capita auto sales in January, 1976, were defined as 100; the readings in the index since then are relative to that 1976 sales level. As you can see, the index moves higher until August of 1978, when per capita auto sales were up nearly 20 percent over 1976. Since then, per capita auto sales have fallen, reaching a low in 2009 that was nearly 50 percent lower than 1976. Since 2009, per capita auto sales have risen nicely, but are still more than 15 percent below peak.
What could explain the negative trend? Two factors come to mind. First, demographics. It has been widely reported that the millennial generation is less interested in owning cars for a variety of reasons, ranging from a weak economy to a cultural shift away from suburban life. However, the data on millennial car purchases is ambiguous; recently, millennials have started buying cars in volumes that look a lot like their elders. And even if millennials are less interested in buying cars, their preferences can’t explain a shift that began in the 1970s, before they were born.
Related: U.S. Companies Are Dying Faster Than Ever
The other factor that may explain the trend is income inequality. A study of car ownership by the Carnegie Foundation found that countries with higher income inequality have fewer cars per capita. The logic is simple: As more income is claimed by the wealthy, there’s less to go around for everyone else. And that means there’s less money for middle and lower income groups to buy and maintain automobiles, among other things.
Here’s a chart of the Gini index for the U.S. since 1947. (The Gini Index is a widely-used measure of income inequality. A higher Gini number means higher inequality.) Note that the Gini reading started climbing in the late ‘70s – the same time when per capita car ownership in the U.S. began to fall.
This chart tells us, not for the first time, that the U.S. has experienced more income inequality since the 1970s. Combined with the per capita auto sales data above, it suggests that as the rich have gotten richer and everyone else has struggled to keep up, car ownership has suffered. Although this is by no means proof of the relationship between income inequality and per capita car ownership over the last 40 years, it hints at an interesting theory – and suggests that the auto industry has good reason to be concerned about growing inequality in the U.S.

Top Reads From The Fiscal Times:
- 6 Reasons Gas Prices Could Fall Below $2 a Gallon
- Hoping for a Raise? Here’s How Much Most People Are Getting
- What the U.S. Must Do to Avoid Another Financial Crisis
Budget ‘Chaos’ Threatens Army Reset: Retired General
One thing is standing in the way of a major ongoing effort to reset the U.S. Army, writes Carter Ham, a retired four-star general who’s now president and CEO of the Association of the U.S. Army, at Defense One. “The problem is the Washington, D.C., budget quagmire.”
The issue is more than just a matter of funding levels. “What hurts more is the erratic, unreliable and downright harmful federal budget process,” which has forced the Army to plan based on stopgap “continuing resolutions” instead of approved budgets for nine straight fiscal years. “A slowdown in combat-related training, production delays in new weapons, and a postponement of increases in Army troop levels are among the immediate impacts of operating under this ill-named continuing resolution. It’s not continuous and it certainly doesn’t display resolve.”
Pentagon Pushes for Faster F-35 Cost Cuts
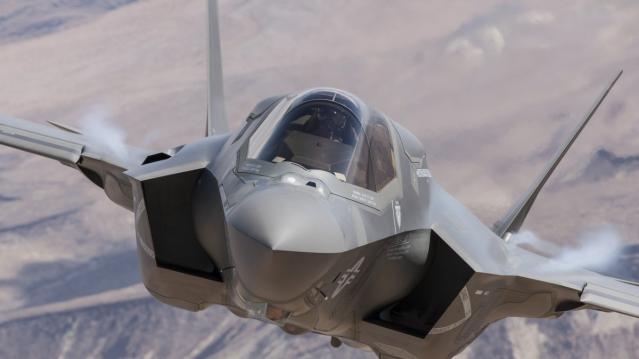
The Pentagon has taken over cost-cutting efforts for the F-35 program, which has been plagued by years of cost overruns, production delays and technical problems. The Defense Department rejected a cost-saving plan proposed by contractors including principal manufacturer Lockheed Martin as being too slow to produce substantial savings. Instead, it gave Lockheed a $60 million contract “to pursue further efficiency measures, with more oversight of how the money was spent,” The Wall Street Journal’s Doug Cameron reports. F-35 program leaders “say they want more of the cost-saving effort directed at smaller suppliers that haven’t been pressured enough.” The Pentagon plans to cut the price of the F-35A model used by the Air Force from a recent $94.6 million each to around $80 million by 2020. Overall, the price of developing the F-35 has climbed above $400 billion, with the total program cost now projected at $1.53 trillion. (Wall Street Journal, CNBC)

Chart of the Day - October 6, 2017
Financial performance for insurers in the individual Obamacare markets is improving, driven by higher premiums and slower growth in claims. This suggests that the market is stabilizing. (Kaiser Family Foundation)

Quote of the Day - October 5, 2017
"The train's left the station, and if you're a budget hawk, you were left at the station." -- Rep. Mark Sanford, R-S.C.