Automakers Are Having a Record Year, but Here’s a Trend that Should Worry Them

U.S. auto sales closed out the summer on a positive note, topping estimates and casting some rosy light on the health of the American consumer. Recording its best August since 2003, the auto industry is on pace to sell 17.8 vehicles in 2015, well ahead of expectations of 17.3 million. If the numbers hold up, 2015 will be the best year ever for U.S. auto sales, beating the 17.4 million mark set in 2000.
The general consensus is that auto industry is in pretty good shape these days. Gas prices and interest rates are low, boosting the market for cars and light trucks. More than 2 million jobs were added to the U.S. economy in the past year, and more jobs is usually good news for auto sales. The unemployment rate has been trending lower for five years, sitting at a relatively healthy 5.3 percent in July.
Related: What's Next for Oil Prices? Look Out Below!
As with any statistic, though, there’s more than one way to look at the situation. Sure, auto sales are climbing as the economy gets stronger and more Americans hit their local car dealers’ lots. At least to some degree, though, higher auto sales should be expected just as a result of U.S. population growth. And those rising monthly sales figures are masking a continuing trend that is more worrisome for the auto industry: per capita auto sales are still in a long-term decline, even including the solid growth the industry has seen since the end of the recession. Doug Short at Advisor Perspectives did the math and made a graph:

According to Short’s analysis, the peak year for per capita auto sales in the U.S. was 1978. As the red line in the graph shows, the trend is negative since then.
In the graph, per capita auto sales in January, 1976, were defined as 100; the readings in the index since then are relative to that 1976 sales level. As you can see, the index moves higher until August of 1978, when per capita auto sales were up nearly 20 percent over 1976. Since then, per capita auto sales have fallen, reaching a low in 2009 that was nearly 50 percent lower than 1976. Since 2009, per capita auto sales have risen nicely, but are still more than 15 percent below peak.
What could explain the negative trend? Two factors come to mind. First, demographics. It has been widely reported that the millennial generation is less interested in owning cars for a variety of reasons, ranging from a weak economy to a cultural shift away from suburban life. However, the data on millennial car purchases is ambiguous; recently, millennials have started buying cars in volumes that look a lot like their elders. And even if millennials are less interested in buying cars, their preferences can’t explain a shift that began in the 1970s, before they were born.
Related: U.S. Companies Are Dying Faster Than Ever
The other factor that may explain the trend is income inequality. A study of car ownership by the Carnegie Foundation found that countries with higher income inequality have fewer cars per capita. The logic is simple: As more income is claimed by the wealthy, there’s less to go around for everyone else. And that means there’s less money for middle and lower income groups to buy and maintain automobiles, among other things.
Here’s a chart of the Gini index for the U.S. since 1947. (The Gini Index is a widely-used measure of income inequality. A higher Gini number means higher inequality.) Note that the Gini reading started climbing in the late ‘70s – the same time when per capita car ownership in the U.S. began to fall.
This chart tells us, not for the first time, that the U.S. has experienced more income inequality since the 1970s. Combined with the per capita auto sales data above, it suggests that as the rich have gotten richer and everyone else has struggled to keep up, car ownership has suffered. Although this is by no means proof of the relationship between income inequality and per capita car ownership over the last 40 years, it hints at an interesting theory – and suggests that the auto industry has good reason to be concerned about growing inequality in the U.S.

Top Reads From The Fiscal Times:
- 6 Reasons Gas Prices Could Fall Below $2 a Gallon
- Hoping for a Raise? Here’s How Much Most People Are Getting
- What the U.S. Must Do to Avoid Another Financial Crisis
Trump’s Cabinet Would Benefit from Tax Plan Too
“Eliminating the estate tax would save the Trump Cabinet over a billion dollars," Oliver Willis writes. "Like Mnuchin, Trump’s secretaries would make out like bandits. Commerce Secretary Wilbur Ross would get an extra $545 million. The family of Education Secretary Betsy DeVos would rake in $900 million. Linda McMahon, head of the Small Business Administration, and her husband, WWE founder Vince McMahon, would take in $250 million. Trump’s own net worth is in dispute, thanks to his failure to reveal his tax returns, but based on his estimated net worth of $3 billion, the estate tax scheme would net him $564 million.” (Shareblue Media, Bloomberg)
A Liberal Economist Shoots Down the GOP’s Fiscal Chicken Hawks
Republicans want a tax cut, but they don’t want to fully pay for it and may be willing to increase the deficit by $1.5 trillion over 10 years. This would continue a troubling cycle, economist Jared Bernstein writes, in which supposed fiscal conservatives “use the deficit argument to block spending, promote fiscal austerity, and small government, conveniently tossing deficit concerns aside when it comes to tax cuts.”
You’ll hear arguments about how increased economic growth will make up for the budgetary effects of the tax cuts, but don’t believe them. “Our fiscal history on this point is clear: Cutting taxes loses revenues, which, unless offset by higher taxes elsewhere or spending cuts, increases the budget deficit, which in turn raises the debt.” When this happens again, and the promised growth effects don’t materialize, the tax cutters will go back to pushing for spending cuts.
The country faces a number of serious challenges, including an aging population that by itself will require increased government spending, and we need a tax policy that does more than drive up the deficit. “The problem with structural deficits — ones that go up even in good times — is that they reveal that we’re unwilling to raise the necessary revenues to support the government we want and need. This enables those who whose goal is to shrink government to point to deficits and debt as their proof that we can’t afford it, whatever ‘it’ is, except when ‘it’ is tax cuts.” (New York Times)
Health Secretary Tom Price Under Fire for Use of Private Jets
 listens to opening remarks prior to testifying before a Senate Finance Committee confirmation hearing on his nomination to be Health and Human Services secretary on Capitol Hill in Washington, U.S., January 24, 2017. REUTERS/Car")
Back in 2009, Tom Price spoke out against House Democrats who wanted to spend $550 million on private jets for lawmakers to use. A Republican representative from Georgia at the time, Price told CNBC that the purchase of the jets was “another example of fiscal irresponsibility run amok.” Now Secretary of Health and Human Services, Price seems to have changed his mind about the virtue of government officials using private jets at taxpayer expense. Just last week, Price used a chartered private jet to travel to three HHS events — including one at a resort in Maine — at an estimated cost of $60,000, Politico reports.
While previous HHS secretaries typically flew commercial, reports indicate that Price has been traveling by private jet for months. “Official travel by the secretary is done in complete accordance with Federal Travel Regulations,” an HHS spokesperson told Politico.
Critics on Twitter have been harsh:
More in-your-face kleptocracy from Tom Price.Take food stamps from poor, hungry kids- spend $25k from taxpayers to charter plane to Philly
— Norman Ornstein (@NormOrnstein) September 20, 2017
1️⃣ Attack Medicaid while trading health stocks.
— Harry Stein (@HarrySteinDC) September 20, 2017
2️⃣ Spend funds that could give someone 4 years of Medicaid coverage to fly a private jet. https://t.co/GO5cfJgWgO
First Mnuchin, now Tom Price. The @realDonaldTrump Cabinet has a big problem charging taxpayers for private flights. https://t.co/th1QbGdfT7
— Ben White (@morningmoneyben) September 20, 2017
Social Security Benefits Due for a Bigger Bump in 2018

In a few weeks the Social Security Administration will announce its cost-of-living adjustment, or COLA, for 2018. Inflation data for the month of August suggests that the adjustment could be the highest in five years, possibly over 2 percent, according to the Washington Examiner. Adjustments for the past five years have been relatively small: The cost of living adjustment for 2017 (announced last October) came in at a modest 0.3 percent, and the adjustment for 2016 was zero. Some retirees have complained in the past about small COLAs, but it’s worth remembering that higher adjustments are driven by higher inflation, which is bad news for people living on fixed incomes.
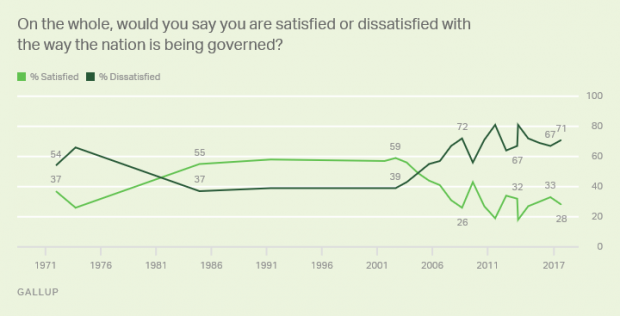
Americans Are Less Satisfied with Government Now Than a Year Ago
Gallup finds that just 28 percent of Americans are satisfied with the way the nation is being governed, down from 33 percent a year ago. And as we approach some potential fiscal battles, it's worth noting that the lowest satisfaction levels since Gallup started updating the measure annually in 2001 came in 2011 (19 percent) after a debt ceiling showdown that led to the U.S. credit rating being downgraded by S&P analysts and in 2013 (18 percent) during a federal government shutdown.