Automakers Are Having a Record Year, but Here’s a Trend that Should Worry Them

U.S. auto sales closed out the summer on a positive note, topping estimates and casting some rosy light on the health of the American consumer. Recording its best August since 2003, the auto industry is on pace to sell 17.8 vehicles in 2015, well ahead of expectations of 17.3 million. If the numbers hold up, 2015 will be the best year ever for U.S. auto sales, beating the 17.4 million mark set in 2000.
The general consensus is that auto industry is in pretty good shape these days. Gas prices and interest rates are low, boosting the market for cars and light trucks. More than 2 million jobs were added to the U.S. economy in the past year, and more jobs is usually good news for auto sales. The unemployment rate has been trending lower for five years, sitting at a relatively healthy 5.3 percent in July.
Related: What's Next for Oil Prices? Look Out Below!
As with any statistic, though, there’s more than one way to look at the situation. Sure, auto sales are climbing as the economy gets stronger and more Americans hit their local car dealers’ lots. At least to some degree, though, higher auto sales should be expected just as a result of U.S. population growth. And those rising monthly sales figures are masking a continuing trend that is more worrisome for the auto industry: per capita auto sales are still in a long-term decline, even including the solid growth the industry has seen since the end of the recession. Doug Short at Advisor Perspectives did the math and made a graph:

According to Short’s analysis, the peak year for per capita auto sales in the U.S. was 1978. As the red line in the graph shows, the trend is negative since then.
In the graph, per capita auto sales in January, 1976, were defined as 100; the readings in the index since then are relative to that 1976 sales level. As you can see, the index moves higher until August of 1978, when per capita auto sales were up nearly 20 percent over 1976. Since then, per capita auto sales have fallen, reaching a low in 2009 that was nearly 50 percent lower than 1976. Since 2009, per capita auto sales have risen nicely, but are still more than 15 percent below peak.
What could explain the negative trend? Two factors come to mind. First, demographics. It has been widely reported that the millennial generation is less interested in owning cars for a variety of reasons, ranging from a weak economy to a cultural shift away from suburban life. However, the data on millennial car purchases is ambiguous; recently, millennials have started buying cars in volumes that look a lot like their elders. And even if millennials are less interested in buying cars, their preferences can’t explain a shift that began in the 1970s, before they were born.
Related: U.S. Companies Are Dying Faster Than Ever
The other factor that may explain the trend is income inequality. A study of car ownership by the Carnegie Foundation found that countries with higher income inequality have fewer cars per capita. The logic is simple: As more income is claimed by the wealthy, there’s less to go around for everyone else. And that means there’s less money for middle and lower income groups to buy and maintain automobiles, among other things.
Here’s a chart of the Gini index for the U.S. since 1947. (The Gini Index is a widely-used measure of income inequality. A higher Gini number means higher inequality.) Note that the Gini reading started climbing in the late ‘70s – the same time when per capita car ownership in the U.S. began to fall.
This chart tells us, not for the first time, that the U.S. has experienced more income inequality since the 1970s. Combined with the per capita auto sales data above, it suggests that as the rich have gotten richer and everyone else has struggled to keep up, car ownership has suffered. Although this is by no means proof of the relationship between income inequality and per capita car ownership over the last 40 years, it hints at an interesting theory – and suggests that the auto industry has good reason to be concerned about growing inequality in the U.S.

Top Reads From The Fiscal Times:
- 6 Reasons Gas Prices Could Fall Below $2 a Gallon
- Hoping for a Raise? Here’s How Much Most People Are Getting
- What the U.S. Must Do to Avoid Another Financial Crisis
Americans Just Went on a $32 Billion Credit Card Shopping Spree

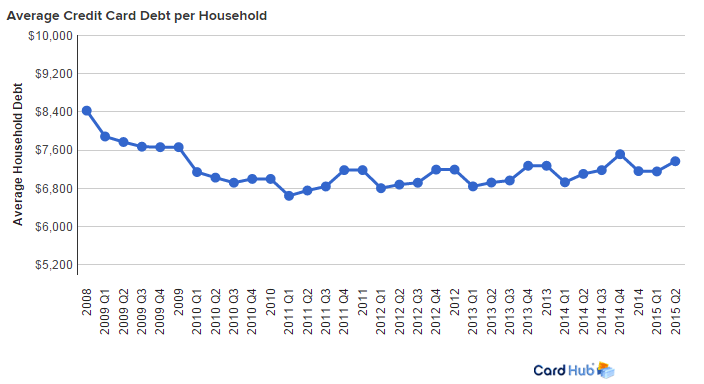
Americans may be heading for another credit card crunch. After paying down almost $35 billion in credit card debt in the first quarter of the year, consumer charged up a storm in the second quarter, racking up $32.1 billion in new debt, according to CardHub, a credit card comparison site. CardHub says that’s the second highest quarterly total since it began keeping data on credit card debt in 2009.
While that buying binge could potentially signal improved confidence in the economy and in their own financial prospects, CardHub warns that the debt risks are building. It projects that consumers will close out the year with an annual net increase of more than $60 billion in credit card debt, with the total credit card debt outstanding climbing to more than $900 billion, the highest since the recession.
Related: 5 Cities with the Most Credit Card Debt
CardHub CEO Odysseas Papadimitriou says that jump brings Americans “perilously close to a tipping point at which balances become unsustainable and delinquency rates skyrocket.”
For 7 out of the past 10 quarters, consumers have racked up more debt than they’ve paid off. Papadimitriou cites that as evidence that consumers are going back to the bad habits they had before the economic downturn.
CardHub based its study on data from the Federal Reserve, and if the results are a sign of trouble then another new report from the Federal Reserve Bank of New York suggests that problem is even worse than it looks. In a report called “Do We Know What We Owe,” the New York Fed found that people widely underestimate their credit card debt, telling the Fed’s survey-takers that it’s about 37 percent lower than what lenders say it is.
So if we are actually getting to a tipping point with credit card debt, it may be even closer than we realize.
Top Reads From The Fiscal Times
- Millions Facing a Hefty Increase in Medicare Premiums in 2016
- How Much Does Our Social Safety Net Cost? $742 Billion a Year and Rising
- The 10 Worst States for Property Taxes
Watch Jeb Bush Do His Best Donald Trump Impression with Stephen Colbert
Unless you've been in your own personal media blackout for the last few days, you're probably aware that Stephen Colbert kicked off his new show Tuesday night and that Jeb Bush was one of his first guests. While the maiden voyage of the new “Late Show” has drawn mixed reviews -- “promising, if he relaxes” says USA Today, referring to the host – the show provided plenty of entertaining bits and compelling if somewhat odd moments.
Like much of the show, Colbert’s conversation with Bush was a mixed bag. Both host and guest seemed a bit nervous and some of their lines fell flat. Surprisingly, one of the more entertaining parts of their conversation never made it on air: Colbert had Bush read some text written in the bombastic voice of Donald Trump. Bush was game for the joke, and the results are worth a look.
The fun at Trump's expense starts at the 2:32 mark, when Stephen Colbert refers to the "big, orange elephant in the room."
Top Reads from The Fiscal Times:
- Fading Fast in New Hampshire, Bush Dips into War Chest
- The 2016 Presidential Primary Carnival Rages On
- There’s Only One Candidate People Actually Like – and It’s Not Trump or Clinton
Here’s Why Home Prices Are Climbing So Quickly

Want to buy a home but finding slim pickings? Blame the builders.
New home construction has not kept pace with the improving job market in recent years and is part of the reason that housing inventory is so scarce and home prices are growing so quickly, according to a report released today by the National Association of Realtors.
After over-building leading up to the housing bubble, developer laid off workers and scaled back construction by more than 75 percent. After the crash many of those workers migrated to other industries, making it harder for builders to quickly ramp up work. There are also fewer builders now than there were a decade ago, with many going bust in the bubble and others consolidating with competitors.
Related: How a Smart Home Can Save You Time and Money
While home starts have come back since the recession, the new NAR report finds that in two-thirds of markets homebuilding activity has not kept pace with the number of newly employed workers. In particular, construction of single-family homes remains at less than half its prerecession levels.
Many of the markets with the largest disparity of jobs versus home construction were hit hardest by the housing crisis but have fully rebounded, including San Jose, San Francisco, San Diego and Miami. New York is also among the top cities where home building has not kept pace.
There are several reasons that new home construction has grown so slowly in recent years, including rising construction and labor costs and tight credit. Despite those headwinds, new home construction is expected to grow by more than 25 percent this year.
Top Reads From The Fiscal Times:
- Can Anyone Stop the $38 Billion Airline Fee Squeeze?
- 7 Common Myths That Can Ruin Your Retirement
- The 25 Most Expensive Cities for Renters
Millennials to Employers: Show Us the Money

When it comes to company loyalty, money matters to millennials. Twenty-nine percent of millennials say that a higher salary is the biggest contributor to their loyalty, according to data released Tuesday by the Staples Advantage Workplace Index.
That compares to 20 percent of the overall workforce who place a priority on salary. The difference could be related to the fact that millennials tend to make lower wages than other workers and face higher fixed costs on things like student loans and rent.
Still, the job market is tightening, making it easier for millennials who feel they are underpaid to look elsewhere for work. The unemployment rate for millennials has fallen by nearly 40 percent since its peak in 2010.
Related: 18 Companies Americans Hate Dealing With the Most
Millennials are willing to work long hours but they want to be able to do so on their own terms. More than half of younger workers said that they work from home after the work day is over, compared to 39 percent of the all workers. Nearly half of millennials said that increased flexibility would improve their happiness.
Other important factors for millennials are office perks such as a gym or free lunches, having an eco-friendly office and a company culture that encourages breaks.
Whether or not they’re happy with their current roles, millennials are looking toward the future with ambition. Seventy percent of those surveyed said they expect to be in a management position in the next five years.
Top Reads from The Fiscal Times:
- Stocks Are Sending a Recession Warning
- The 10 Fastest-Growing Jobs Right Now
- Mark Cuban: The Lesson Investors Can Learn From China
Gas Prices at an 11-Year Low for Labor Day Weekend

Drivers will be paying less at the pump as we head into one of the largest travel weekends of the year. Gas prices over Labor Day weekend haven’t been this low since 2004.
The national average price of gas is currently $2.44 per gallon, 99 cents less than this time last year, according to AAA. The average consumer can expect to save $15 to $25 on each trip to the gas station.
Related: 6 Reasons Gas Prices Could Fall Below $2 A Gallon
AAA estimates that 35.5 million people are planning to travel this weekend, a 1 percent increase from last year. The majority of travelers, 30.4 million, are expected to drive to their destinations, a rise of 1.1 percent from last year.
Gasoline prices are moving lower thanks to the falling price of crude oil. Oil has been hit by worries over economic growth in emerging markets, Iranian oil flooding the market and crude oil inventories rising due to economic and weather factors, a U.S. Energy Information Administration report finds.
For drivers, there’s more good news ahead. AAA expects gas prices to keep falling, with gas selling for $2 or less a gallon by Christmas in many parts of the U.S.
Top Reads From The Fiscal Times
- The 10 Worst States for Property Taxes
- Obama to GOP: Don’t Kill the Economy This Fall
- Why China’s Slowdown Will Lead to Sustainable Growth