Automakers Are Having a Record Year, but Here’s a Trend that Should Worry Them

U.S. auto sales closed out the summer on a positive note, topping estimates and casting some rosy light on the health of the American consumer. Recording its best August since 2003, the auto industry is on pace to sell 17.8 vehicles in 2015, well ahead of expectations of 17.3 million. If the numbers hold up, 2015 will be the best year ever for U.S. auto sales, beating the 17.4 million mark set in 2000.
The general consensus is that auto industry is in pretty good shape these days. Gas prices and interest rates are low, boosting the market for cars and light trucks. More than 2 million jobs were added to the U.S. economy in the past year, and more jobs is usually good news for auto sales. The unemployment rate has been trending lower for five years, sitting at a relatively healthy 5.3 percent in July.
Related: What's Next for Oil Prices? Look Out Below!
As with any statistic, though, there’s more than one way to look at the situation. Sure, auto sales are climbing as the economy gets stronger and more Americans hit their local car dealers’ lots. At least to some degree, though, higher auto sales should be expected just as a result of U.S. population growth. And those rising monthly sales figures are masking a continuing trend that is more worrisome for the auto industry: per capita auto sales are still in a long-term decline, even including the solid growth the industry has seen since the end of the recession. Doug Short at Advisor Perspectives did the math and made a graph:

According to Short’s analysis, the peak year for per capita auto sales in the U.S. was 1978. As the red line in the graph shows, the trend is negative since then.
In the graph, per capita auto sales in January, 1976, were defined as 100; the readings in the index since then are relative to that 1976 sales level. As you can see, the index moves higher until August of 1978, when per capita auto sales were up nearly 20 percent over 1976. Since then, per capita auto sales have fallen, reaching a low in 2009 that was nearly 50 percent lower than 1976. Since 2009, per capita auto sales have risen nicely, but are still more than 15 percent below peak.
What could explain the negative trend? Two factors come to mind. First, demographics. It has been widely reported that the millennial generation is less interested in owning cars for a variety of reasons, ranging from a weak economy to a cultural shift away from suburban life. However, the data on millennial car purchases is ambiguous; recently, millennials have started buying cars in volumes that look a lot like their elders. And even if millennials are less interested in buying cars, their preferences can’t explain a shift that began in the 1970s, before they were born.
Related: U.S. Companies Are Dying Faster Than Ever
The other factor that may explain the trend is income inequality. A study of car ownership by the Carnegie Foundation found that countries with higher income inequality have fewer cars per capita. The logic is simple: As more income is claimed by the wealthy, there’s less to go around for everyone else. And that means there’s less money for middle and lower income groups to buy and maintain automobiles, among other things.
Here’s a chart of the Gini index for the U.S. since 1947. (The Gini Index is a widely-used measure of income inequality. A higher Gini number means higher inequality.) Note that the Gini reading started climbing in the late ‘70s – the same time when per capita car ownership in the U.S. began to fall.
This chart tells us, not for the first time, that the U.S. has experienced more income inequality since the 1970s. Combined with the per capita auto sales data above, it suggests that as the rich have gotten richer and everyone else has struggled to keep up, car ownership has suffered. Although this is by no means proof of the relationship between income inequality and per capita car ownership over the last 40 years, it hints at an interesting theory – and suggests that the auto industry has good reason to be concerned about growing inequality in the U.S.

Top Reads From The Fiscal Times:
- 6 Reasons Gas Prices Could Fall Below $2 a Gallon
- Hoping for a Raise? Here’s How Much Most People Are Getting
- What the U.S. Must Do to Avoid Another Financial Crisis
This Is America’s Favorite Credit Card
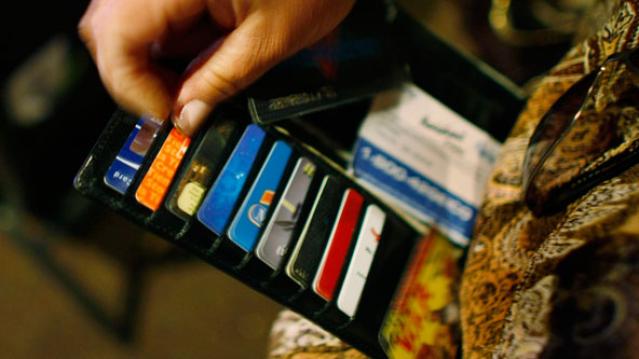
According to consumers, it does pay to Discover.
For the second year in a row, Discover has ranked the highest in customer satisfaction among credit card issuers, according to the results of a new survey by J.D. Power.
Discover received a score of 828 out of 1,000 in the survey, based on credit card terms, billing and payment, rewards, benefits and services, and problem resolution. American Express placed second with a score of 820, and Chase ranked third at 792.
Overall satisfaction with credit cards hit a record high of 790, up from 778 last year.
Related: 3 High-Tech Ideas to Fraud-Proof Our Credit Cards
Consumers were more likely to use their rewards last year, with more than half having done so in the past six months. That could be because rewards are getting better as banks get more creative with wooing and keeping customers, many of whom are still lukewarm about spending.
“When customers feel the rewards are attractive and when they redeem rewards more frequently, satisfaction improves, they spend more, and they are more likely to recommend the card to friends and family members,” Jim Miller, J.D. Power senior director of banking services, said in a statement.
Customers who redeem rewards spend an average of $1,128 per month, compared to $645 by those who don’t redeem rewards.
Even though they’re more satisfied with their credit cards, Americans are still concerned about ID theft. Less than a third of those surveyed felt their personal information was very secure, and just 16 percent thought that security had improved since last year.
Top Reads from the Fiscal Times:
- Trump: ‘I’ve Gained Such Respect for the People That Like Me’
- Why McDonald’s Could Suddenly Be Responsible for Millions of New Employees
- Americans Want Medicare to Negotiate Better Deals on Drugs
Long Hours at Work Are Costing You More Than Your Social Life

Putting in long hours at the office might impress your boss, but they’re certainly not helping your health.
A new study published in The Lancet found that individuals who worked 55 hours per week or more had a 1-3 times greater risk of a stroke compared to those who worked 40 hours a week. Long working hours were also associated with an increased chance of coronary heart disease, but this association was found to be weaker than that for a stroke.
The analysis was the largest study conducted thus far of the affiliation between working hours and cardiovascular health, including data on more than 600,000 individuals in Europe, the U.S., and Australia.
Researchers believe the constant triggering of the stress response from overwork induces the stroke, often resulting in sudden death. In addition, behavioral activities that stem from the longer hours also contribute to the heightened chance of a stroke.
Employees who work longer hours are found to rely more on heavy alcohol consumption as a way to reduce stress, but drinking only increases the risk for all types of strokes. In addition, more time at a desk means long periods of physical inactivity, which can increase the risk of stroke.
A study by Credit Loan shows that employees worldwide are working more than 40 hours per week. The U.S. leads the pack with the highest percentages of overtime workers – 85.8 percent of males and 66.5 percent of females.
Someone ought to tell Jeb Bush before he repeats what he said early in the campaign -- that Americans need to put in more hours at work.
Why Millennials Are Waiting So Long to Buy Their First Homes

They may finally be moving out of their parents’ basements, but don’t expect those boomerang kids to be taking out a mortgage any time soon.
Today’s first-time homebuyer rents for an average of six years before buying his or her first home, according to a new analysis by Zillow. Time spent renting has been marching mostly upward since the 1970s, when first-time buyers rented for just 2.6 years before purchasing a home.
Today’s first-time buyers are also more likely to be single and older (with an average age of 32.5) than previous generations.
“Millennials are delaying all kinds of major life decisions, like getting married and having kids, so it makes sense that they would also delay buying a home,” Zillow Chief Economist Svenja Gudell said in a statement.
Related: Found Your Dream Home? 7 Tips for Getting the Best Deal
Part of the reason for that delay could be that homes cost much more than they did decades ago. Today’s homebuyer makes roughly the same amount of money in inflation-adjusted terms as a buyer in the 1970s, but the homes that they’re purchasing are about 60 percent more expensive.
There are other roadblocks for first-timers. Limited inventory and strong competition make the home buying process difficult for property virgins and student debt can make it tougher to get a mortgage.
Those six years spent renting aren’t coming cheap, either. In 2013, almost half of all renters were spending more than 30 percent of their income on housing, with more than a quarter sending half their income to their landlord every month, according to the “State of the Nation’s Housing 2015” report issued in June by the Harvard Joint Center for Housing Studies. That makes it pretty tough to save for a down payment.
Top Reads from the Fiscal Times:
- Trump as Commander in Chief? Tune in for a Foreign Policy Reality Show
- Clinton’s Email Fail May Be Innocent, but Americans Still Don’t Trust Her
- As Obamacare Costs Rise, the GOP Has a Real Chance to Reform Health Care
Remember the Ice Bucket Challenge? It Actually Did Some Good

It turns out all those videos of people dumping buckets of ice water on their heads that clogged your newsfeed last summer helped scientists make a major breakthrough in ALS research. (ALS stands for amyotrophic lateral sclerosis, a neurodegenerative disease also known as Lou Gehrig’s disease.)
A new study published in the journal Science last week details a new understanding of an important protein – TDP-43 – that is dysfunctional in more than 90 percent of ALS cases. The Johns Hopkins scientists behind the research thanked the Ice Bucket Challenge for helping them with the discovery by raising $115 million in donations for the ALS Association.
Related: The 9 Most Amazing ALS Ice Bucket Challenges
“We want to encourage all of you to continue this Ice Bucket Challenge to really push this work forward,” professor Philip Wong said in a YouTube video.
More than 17 million videos were uploaded to Facebook of people pouring cold water on themselves, including celebrities like Taylor Swift, Oprah, and Bill Gates. The money raised through the challenge helped the ALS Association triple the amount it typically spends on research for the disease each year.
The ALS Association has been encouraging people to once again participate in the challenge this August, having introduced the hashtag #EveryAugustUntilACure. And it’s working – every Major League Baseball team has pledged to take the Ice Bucket Challenge some time this month.
Top Reads From The Fiscal Times
- Why McDonald’s Could Suddenly Be Responsible for Millions of New Employees
- Mark Cuban: Here’s Why Republicans Will Lose the Election
- 6 Reasons Gas Prices Could Fall Below $2 a Gallon
You Won’t Believe How Much Diabetes is Costing the U.S.

The budget-busting price of Sovaldi, a drug used to treat hepatitis C has generated wave after wave of media attention, but it’s far from the only drug creating cost problems for patients and insurers.
As Michelle Andrews of Kaiser Health News points out, diabetes affects 29 million Americans, or 10 times as many people as hepatitis C, and the costs of treating it have been rising quickly. And because it’s a chronic condition, people require lifetime care.
Related: Diabetes Detection Up in Pro-Obamacare States
In 2011, the average annual health spending for individuals with diabetes was $14,093. Two years later, it had risen to $14,999, according to the Healthcare Cost Institute. In contrast, a person without diabetes spent about $10,000 less in medical costs in 2013. Pharmacy provider Express Scripts said earlier this year that 2014 marked the fourth year in a row that medication used to treat diabetes were the most expensive of any traditional drug class.
In all, diabetes costs totaled an estimated $245 billion in 2012, including both direct medical expenses and indirect costs from disability and lost work productivity.
While some of the most popular diabetes drugs aren’t particularly expensive, the new brand-name drugs that are continually being introduced offer more effective treatment and fewer side effects — but also come with a higher price tag. Less than half of the diabetes prescription treatments filled in 2014 were generic.
Nearly a century after its discovery in 1921, insulin is still a common form of treatment for the millions of people with type 1 diabetes, yet there is still no generic form available. Patent protection has been extended in some cases due to improvements in existing formulations. Once those patents expire, Andrews notes, biologically similar drugs could replace them and reduce the price by up to 40 percent.
Related: This Disease Hikes Health Care Costs By More than $10,000 a Year
The financial ramifications of diabetes don’t just stem from the cost of drugs or medical treatment — it’s also been proven that people with diabetes have a high-school dropout rate that is six percentage points higher than those without the disease, according to a Health Affairs study. In addition, young adults with diabetes are four to six percentage points less likely to attend college than those without the disease.
Diabetes also contributes to lower employment and wages. On average, a person with diabetes earns $160,000 less over the course of their lives than people who don’t develop the disease. By age 30, a person with diabetes is 10 percent less likely to be employed.
So even if it’s not generating as many headlines as hepatitis C at any given point in time, the costs of diabetes can’t be ignored.
Top Reads From The Fiscal Times
- The 10 Worst States for Property Taxes
- Two-Thirds of Americans Believe Social Security Is in a Crisis State
- Why McDonald’s Could Suddenly Be Responsible for Millions of New Employees