Automakers Are Having a Record Year, but Here’s a Trend that Should Worry Them

U.S. auto sales closed out the summer on a positive note, topping estimates and casting some rosy light on the health of the American consumer. Recording its best August since 2003, the auto industry is on pace to sell 17.8 vehicles in 2015, well ahead of expectations of 17.3 million. If the numbers hold up, 2015 will be the best year ever for U.S. auto sales, beating the 17.4 million mark set in 2000.
The general consensus is that auto industry is in pretty good shape these days. Gas prices and interest rates are low, boosting the market for cars and light trucks. More than 2 million jobs were added to the U.S. economy in the past year, and more jobs is usually good news for auto sales. The unemployment rate has been trending lower for five years, sitting at a relatively healthy 5.3 percent in July.
Related: What's Next for Oil Prices? Look Out Below!
As with any statistic, though, there’s more than one way to look at the situation. Sure, auto sales are climbing as the economy gets stronger and more Americans hit their local car dealers’ lots. At least to some degree, though, higher auto sales should be expected just as a result of U.S. population growth. And those rising monthly sales figures are masking a continuing trend that is more worrisome for the auto industry: per capita auto sales are still in a long-term decline, even including the solid growth the industry has seen since the end of the recession. Doug Short at Advisor Perspectives did the math and made a graph:

According to Short’s analysis, the peak year for per capita auto sales in the U.S. was 1978. As the red line in the graph shows, the trend is negative since then.
In the graph, per capita auto sales in January, 1976, were defined as 100; the readings in the index since then are relative to that 1976 sales level. As you can see, the index moves higher until August of 1978, when per capita auto sales were up nearly 20 percent over 1976. Since then, per capita auto sales have fallen, reaching a low in 2009 that was nearly 50 percent lower than 1976. Since 2009, per capita auto sales have risen nicely, but are still more than 15 percent below peak.
What could explain the negative trend? Two factors come to mind. First, demographics. It has been widely reported that the millennial generation is less interested in owning cars for a variety of reasons, ranging from a weak economy to a cultural shift away from suburban life. However, the data on millennial car purchases is ambiguous; recently, millennials have started buying cars in volumes that look a lot like their elders. And even if millennials are less interested in buying cars, their preferences can’t explain a shift that began in the 1970s, before they were born.
Related: U.S. Companies Are Dying Faster Than Ever
The other factor that may explain the trend is income inequality. A study of car ownership by the Carnegie Foundation found that countries with higher income inequality have fewer cars per capita. The logic is simple: As more income is claimed by the wealthy, there’s less to go around for everyone else. And that means there’s less money for middle and lower income groups to buy and maintain automobiles, among other things.
Here’s a chart of the Gini index for the U.S. since 1947. (The Gini Index is a widely-used measure of income inequality. A higher Gini number means higher inequality.) Note that the Gini reading started climbing in the late ‘70s – the same time when per capita car ownership in the U.S. began to fall.
This chart tells us, not for the first time, that the U.S. has experienced more income inequality since the 1970s. Combined with the per capita auto sales data above, it suggests that as the rich have gotten richer and everyone else has struggled to keep up, car ownership has suffered. Although this is by no means proof of the relationship between income inequality and per capita car ownership over the last 40 years, it hints at an interesting theory – and suggests that the auto industry has good reason to be concerned about growing inequality in the U.S.

Top Reads From The Fiscal Times:
- 6 Reasons Gas Prices Could Fall Below $2 a Gallon
- Hoping for a Raise? Here’s How Much Most People Are Getting
- What the U.S. Must Do to Avoid Another Financial Crisis
This Is the Most Annoying Thing About Customer Service

The number of Americans fed up with lousy customer service is decreasing but there are still some practices that irritate nearly everyone, according to a newly published report in Consumer Reports’ September issue.
There was a tie for the top customer service complaint. Seventy-five per percent of shoppers surveyed were annoyed by the inability to get a live person on the phone and by dealing with a representative who was rude or condescending.
Seventy-four percent of consumers said they were highly annoyed at being disconnected from a customer service rep, and 71 percent were dissatisfied that they’d been disconnected and then unable to reach the same representative again.
“Many companies today are simply awful at resolving customer protections, despite investments in whiz-bang technologies and considerable advertising about their customer focus,” Scott Broetzman, president of Customer Care Measurement & Consulting, told the magazine.
In a separate report released this week, 24/7 Wall Street found that Amazon.com is the best big company for customer service, followed by Chick-fil-A and Apple. The companies in the publication’s “Customer Service Hall of Shame” include Bank of America, DirectTV and Comcast.
In order to get the best possible customer service, Consumer Reports recommends using the phone, rather than email; showing—and asking for—empathy; and escalating when necessary.
The magazine also suggests putting technology to work. The website Dial a Human can help find the best customer service number for a company, and the service Lucy Phone lets you enter a company’s name and number and then calls you when a rep becomes available so you don’t have to wait on hold.
Top Reads From The Fiscal Times:
- The Next Debt Crisis Could Be Much Worse than in 2013, GAO Warns
- The New Generation of ‘Genuinely Creepy’ Electronic Devices
- Who Are These People Giving Money to Donald Trump?
The Weakest Economic Recovery Since World War II Putters Along
New GDP data released today shows an economy that continues to grow, though at a disappointingly moderate pace.
The good news is that GDP growth picked up after the weak, snow-encrusted first quarter of 2015, when the economy eked out a 0.6 percent growth rate. The bad news is that growth was expected to hit a 2.5 percent rate or better in the second quarter, but initial estimates arriving today pegged that rate at 2.3 percent. Over the first six months of the year, the economy has expanded at an annual rate of 1.5 percent.
The U.S. recession officially ended in the second quarter of 2009. Since then, growth has been relatively steady but lackluster. Compared to other recoveries since the end of World War II, the current recovery is notably weak – without question the weakest of the bunch. The average annual growth rate from 2011 through 2014 was 2.0 percent, based on updated figured released today.
Economists have argued about the causes — a glut of capital, excessive regulation, the domination of finance, low wages driving weak demand — but the simple fact remains: This is a feeble recovery.
This graphic we produced on the Federal Reserve Bank of Minneapolis’s website tells the story – look for the bright red line:

Top Reads from The Fiscal Times:
- The Kids Aren't Alright: More Millenials Are Living with Their Parents
- How Millenials Could Damage the U.S. Economy
- The Pain the Job Numbers Don’t Show
The Shocking Secret About How Your Car Insurance Rate Gets Set
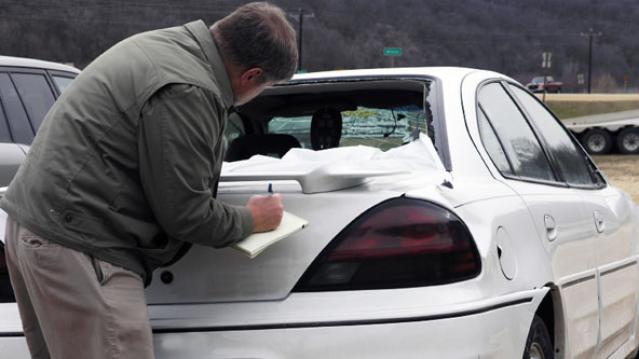
Most drivers probably know that if they get into an accident, their insurance rates are also likely to take a hit. But a new analysis by Consumer Reports finds that your car insurance premiums are increasingly based on factors such as your credit score that are unrelated to your driving record.
How well you drive may actually have little connection to how much you pay for insurance, the consumer group found.
In a two-year investigation, Consumer Reports analyzed more than 2 billion insurance price quotes obtained from more than 700 insurers across the country. It found that in many states a bad credit history will drive up your insurance premiums more than a drunk driving conviction.
“What we found is that behind the rate quotes is a pricing process that judges you less on driving habits and increasingly on socioeconomic factors,” the consumer organization reports. “These include your credit history, whether you use department-store or bank credit cards, and even your TV provider. Those measures are then used in confidential and often confounding scoring algorithms.”
Consumer Reports says it found that most car insurance companies use about 30 elements of the nearly 130 available in a credit report to construct their own secret score for policyholders, and that credit scores could have more of an impact on premiums than any other factor. Drivers with the best credit scores were charged up to $526 less than similar drivers with only “good” scores, depending on where they lived. Only three states — California, Hawaii and Massachusetts — prohibit insurers from factoring in credit scores when setting prices.
Drivers are legally required to carry car insurance, but the lack of pricing transparency makes it harder for them to make informed decisions about which policy to buy. “Because insurance companies are under no obligation to tell you what score they have cooked up for you, you have no idea whether you have a halo over your head or a bull’s-eye on your back for a price increase,” Consumer Reports says.
Industry advertising that promotes special discounts, such as for bundling home and car insurance, only muddles the purchasing process because those special deals don’t actually save people much money, Consumer Reports found.
The organization says it’s high time for truth in car insurance, and it’s asking consumers to sign a petition demanding that insurers -- and the state regulators who oversee them -- use price-setting practices that are tied to more meaningful factors, like driving records. It is also asking consumers to tweet the National Association of Insurance Commissioners, @NAIC_News, and tell them to “Price me by how I drive, not by who you think I am! #FixCarInsurance.”
For more information on state-by-state insurance premiums, or to sign the Consumer Reports petition, go to ConsumerReports.org/FixCarinsurance.
Top Reads From The Fiscal Times:
- Americans Are About to Get a Nice Fat Pay Raise
- How Millenials Could Damage the U.S. Economy
- The Pain the Job Numbers Don’t Show
The Kids Aren’t Alright: More Millennials Are Living with Their Parents

Pity the millennial, poster child of the Great Recession. A popular meme portrays the typical millennial as a basement-dwelling economic loser, forever condemned to live in the nether regions of his parent’s house. Unfortunately, that meme is not without basis. The recession seem to have hit millennials particularly hard, making it even more difficult for young people to find good jobs and to establish their own households.
In some respects, things are looking up for millennials. The U.S. job market is strengthening, making it easier to find work, and wages are starting to creep higher. The unemployment rate for young adults (ages 18 to 34, excluding full-time college students) has been heading lower since peaking near 12 percent in 2010; the latest unemployment reading for millennials is 7.7 percent.
However, there is one notable sticking point, and it echoes that basement-dwelling meme. Even though household formation rates have rebounded overall, millennials are still not moving out and establishing their own households like they used to. In fact, more millennials are living with parents or relatives than before the recession, according to new research from Pew.
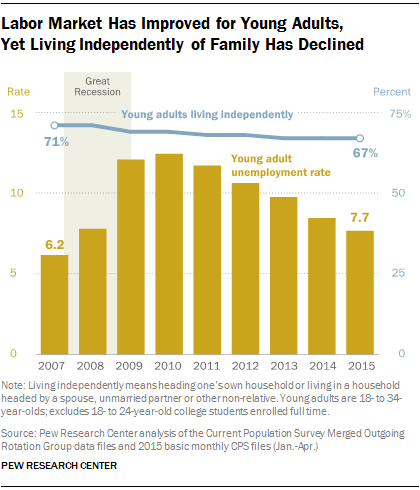
In 2007, before the recession hit, 71 percent of millennials were living independently. In 2015, that number has fallen to 67 percent, with no sign of bottoming.
On the flip side, 22 percent of young adults were living in their parents’ homes in 2007. That number has risen to 26 percent this year.
The Pew report doesn’t look at why millennials are sticking so close to home. However, it does suggest that the relatively simple economic argument about the lack of good jobs no longer tells the whole story. Since the economy is recovering, however unevenly, there are likely other factors in play. One could be cultural: More young people simply enjoy living at home and are in no hurry to move out. Perhaps the U.S. is becoming more like Italy, where adult children often live at home until they marry.
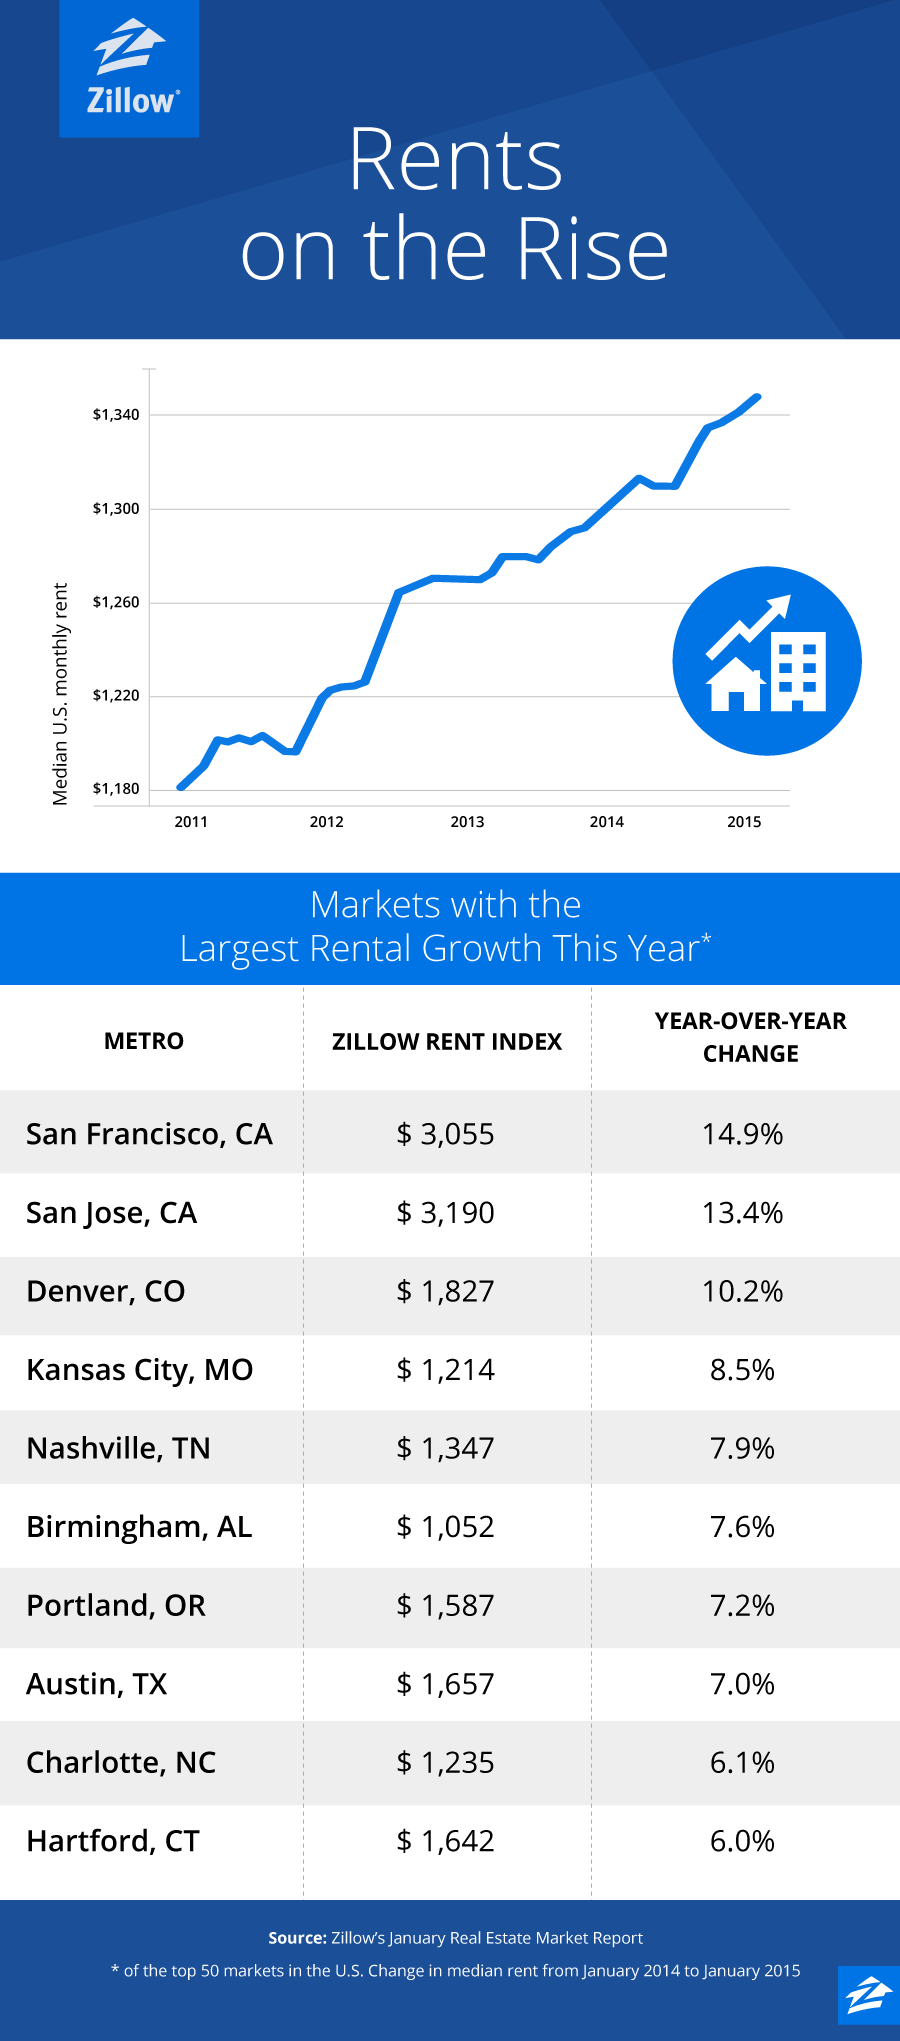
That’s not to say that money plays no role in the trend, though. One big economic factor not addressed in the Pew report is pretty basic: rising rents. This graphic from Zillow makes it clear that rents have been soaring all over the country. More than $3,000 for a one bedroom in San Francisco? With those kind of numbers, living at home makes all the sense in the world.
DOJ Indicts Democratic Lawmaker for Corruption
Martin Matishak, The Fiscal Times
The Justice Department has indicted Rep. Chaka Fattah (D-PA) on almost 30 federal counts of political corruption.
The 11-term congressman and four associates were indicted on 29 federal charges, including bribery, money laundering, falsification of records, and multiple counts of bank and mail fraud, the department announced Wednesday.
Related: Billions in Unfinished Business as Congress Heads Out for Vacation
The charges against Fattah and his associates stem from his failed run for Philadelphia mayor in 2007.
Fattah and the others "embarked on a wide-ranging conspiracy involving bribery, concealment of unlawful campaign contributions and theft of charitable and federal funds to advance their own personal interests,” according to Assistant Attorney General Leslie R. Caldwell.
Justice alleges that Fattah borrowed $1 million from a wealthy donor during his mayoral bid and that he returned $400,000 in unused funds and developed a scheme to repay the remaining $600,000 by tapping charitable and federal grants through a local non-profit the Pennsylvania lawmaker created.
Federal officials also allege that the Fattah sough to repay supporters by offering federal grants and used funds from both his mayoral and congressional campaigns to pay down his son's student loan debts of around $23,000.
"Public corruption takes a particularly heavy toll on our democracy because it undermines people’s basic belief that our elected leaders are committed to serving the public interest, not to lining their own pockets,” she said in a statement.
House Minority Leader Nancy Pelosi (D-CA) said that Fattah has stepped down as the top Democrat on the House Appropriations Commerce, Justice, Science and Related Agencies subcommittee.