Automakers Are Having a Record Year, but Here’s a Trend that Should Worry Them

U.S. auto sales closed out the summer on a positive note, topping estimates and casting some rosy light on the health of the American consumer. Recording its best August since 2003, the auto industry is on pace to sell 17.8 vehicles in 2015, well ahead of expectations of 17.3 million. If the numbers hold up, 2015 will be the best year ever for U.S. auto sales, beating the 17.4 million mark set in 2000.
The general consensus is that auto industry is in pretty good shape these days. Gas prices and interest rates are low, boosting the market for cars and light trucks. More than 2 million jobs were added to the U.S. economy in the past year, and more jobs is usually good news for auto sales. The unemployment rate has been trending lower for five years, sitting at a relatively healthy 5.3 percent in July.
Related: What's Next for Oil Prices? Look Out Below!
As with any statistic, though, there’s more than one way to look at the situation. Sure, auto sales are climbing as the economy gets stronger and more Americans hit their local car dealers’ lots. At least to some degree, though, higher auto sales should be expected just as a result of U.S. population growth. And those rising monthly sales figures are masking a continuing trend that is more worrisome for the auto industry: per capita auto sales are still in a long-term decline, even including the solid growth the industry has seen since the end of the recession. Doug Short at Advisor Perspectives did the math and made a graph:

According to Short’s analysis, the peak year for per capita auto sales in the U.S. was 1978. As the red line in the graph shows, the trend is negative since then.
In the graph, per capita auto sales in January, 1976, were defined as 100; the readings in the index since then are relative to that 1976 sales level. As you can see, the index moves higher until August of 1978, when per capita auto sales were up nearly 20 percent over 1976. Since then, per capita auto sales have fallen, reaching a low in 2009 that was nearly 50 percent lower than 1976. Since 2009, per capita auto sales have risen nicely, but are still more than 15 percent below peak.
What could explain the negative trend? Two factors come to mind. First, demographics. It has been widely reported that the millennial generation is less interested in owning cars for a variety of reasons, ranging from a weak economy to a cultural shift away from suburban life. However, the data on millennial car purchases is ambiguous; recently, millennials have started buying cars in volumes that look a lot like their elders. And even if millennials are less interested in buying cars, their preferences can’t explain a shift that began in the 1970s, before they were born.
Related: U.S. Companies Are Dying Faster Than Ever
The other factor that may explain the trend is income inequality. A study of car ownership by the Carnegie Foundation found that countries with higher income inequality have fewer cars per capita. The logic is simple: As more income is claimed by the wealthy, there’s less to go around for everyone else. And that means there’s less money for middle and lower income groups to buy and maintain automobiles, among other things.
Here’s a chart of the Gini index for the U.S. since 1947. (The Gini Index is a widely-used measure of income inequality. A higher Gini number means higher inequality.) Note that the Gini reading started climbing in the late ‘70s – the same time when per capita car ownership in the U.S. began to fall.
This chart tells us, not for the first time, that the U.S. has experienced more income inequality since the 1970s. Combined with the per capita auto sales data above, it suggests that as the rich have gotten richer and everyone else has struggled to keep up, car ownership has suffered. Although this is by no means proof of the relationship between income inequality and per capita car ownership over the last 40 years, it hints at an interesting theory – and suggests that the auto industry has good reason to be concerned about growing inequality in the U.S.

Top Reads From The Fiscal Times:
- 6 Reasons Gas Prices Could Fall Below $2 a Gallon
- Hoping for a Raise? Here’s How Much Most People Are Getting
- What the U.S. Must Do to Avoid Another Financial Crisis
Here’s the Scoop: Fun Facts for National Ice Cream Day
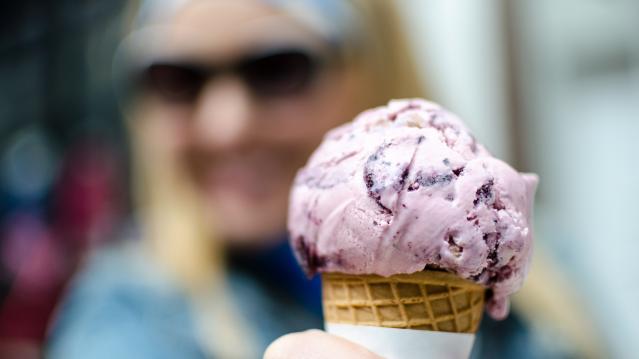
When President Ronald Reagan in 1984 designated the month of July as National Ice Cream Month and declared the third Sunday of July as National Ice Cream Day, he probably never could have foreseen a time when flavors of the treat included Pork Rind, Strawberry Durian or Squid.
Ice cream shops around the country will be celebrating their special day again this Sunday, July 19. Carvel stores will be offering a buy-one-get-one-free deal on any size or flavor of soft-serve cones. Friendly’s is celebrating its 80th birthday this weekend, with participating stores also offering buy-one-get-one-free deals. Baskin-Robbins is offering a free upgrade to waffle cones with double scoops during the entire month of July. It also will offer 31 percent off all its ice cream sundaes on Friday, July 31.
Related: Born in the USA: 24 Iconic American Foods
Those chains offer a wide variety of flavors, but probably nothing quite as exotic as the OddFellows Ice Cream Co. in New York City, known for formulations loaded with unusual ingredients: Edamame, Chorizo Caramel Swirl, Cornbread and Maple Bacon Pecan. OddFellows co-owner Mohan Kumar says National Ice Cream Day will be just a regular Sunday for him and his stores: “It’s a beautiful day for ice cream every day.”
As you consider indulging in a frozen snack, here are some fun facts to fuel our red hot passion for ice cream:
Who Screams for Ice Cream: California, Indiana, Pennsylvania, Texas and New York are the states that consume the most ice cream. California also produces the most ice cream—over 142,000 gallons every year. About 10.3 percent of all the milk produced by U.S. dairy farmers is used to make ice cream. The five most popular brands in the U.S. are private labels, followed by Blue Bell, Haagen-Dazs, Breyers and Ben & Jerry’s. According to the International Dairy Foods Association, vanilla is America’s favorite flavor of ice cream, followed by chocolate. And how’s this for being ice cream crazy? Ben & Jerry’s employees get three free pints a day. They also get a free gym membership.
Hard Facts About Soft Serve: Despite many headlines to the contrary, it does not look like former British Prime Minister Margaret Thatcher invented soft-serve ice cream before she became known as the Iron Lady. The honor instead goes to Tom Carvel of Carvel ice cream or Dairy Queen co-founder J. F. McCullough. In Carvel’s case, his ice cream truck got a flat tire in Hartsdale, New York, in 1934. As the ice cream started to melt, he noticed its soft, creamy consistency and began selling it right from the truck. Two years later, he opened his first Carvel shop at the site where the truck first broke down.
Related: The 9 Most Expensive Junk Foods
Why We’re All Coneheads: Italo Marchiony, an Italian immigrant, was granted a patent for waffle-like ice cream cups in New York City in December 1903. But he may not be the father of the cones we enjoy today. As the story goes, Arnold Fornachou, an ice cream vendor at the 1904 World’s Fair in St. Louis, ran out of dishes. His neighbor, a Syrian man, was selling crisp, Middle Eastern pastries called Zalabias. When rolled up, the waffle-like Zalabias made a perfect cone to hold the ice cream. The International Association of Ice Cream Manufacturers and the International Dairy Foods Association credit Ernest A. Hamwi, the pastry maker, with creating the cone, but others have also claimed credit — including Abe Doumar, another Syrian immigrant at the 1904 fair who would go on to produce the first machine to mass-produce ice cream waffle cones.
Tiny Bubbles, Big Business: How Seltzer Became the Hot New Drink
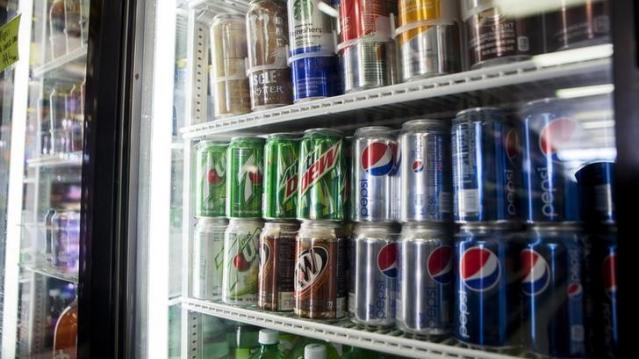
Struggling to decide between healthy but boring water and sweet, sugary soda, Americans are increasingly turning to fizzy water to quench their thirst.
Although soda remains the leader in the soft drink category, soda consumption has fallen for the 10th year in a row, to the lowest level since 1986, according to The Wall Street Journal. Americans have been dropping sugary soda for years due to health concerns, but lately even diet soda has been losing popularity over worries about artificial sweeteners.
Sales of fizzy water — the category includes such well-known brands as Perrier and San Pellegrino — have grown to about $1.5 billion a year, more than doubling since 2010, according to data from industry research firm Euromonitor quoted in The Washington Post.
Related: How Coke Beat Pepsi in the New Cola Ad War
One of the top new brands is National Beverage’s LaCroix Sparkling Water, whose dozen flavors of bubbly H20 seem to be aimed at millennials in particular. The brand’s bright, colorful cans convey an alternative vibe, and the drink’s Instagram is loaded with attractive young people hoisting a can at pools, beaches and other relaxing places.
National Beverage credited sparkling water as the main factor that grew the company’s stock 75 percent over the last five years. Sales of the LaCroix brand alone have grown to $175 million, almost tripling since 2009.
Another rapidly growing brand, Sparkling Ice, owned by Talking Rain Beverage Company, saw sales boom to more than $384 million in 2014 from $2.7 million in 2009.
Gary Hemphill, managing director and COO of research at Beverage Marketing, sees the sales of seltzer and sparkling water only increasing as consumer demand for healthier refreshments grows.
Hackers’ Delight: 1 Million Miles for Reporting United Airlines Security Flaws
Now here’s a rewards program Julian Assange could love. United Airlines has confirmed that it paid 1 million frequent flier miles each to two hackers who found serious flaws and security breaches in its computer systems.
Related: Millions of Samsung Galaxy Phones May Be Vulnerable to Hackers
This past May, United started a “bug bounty” program to find loopholes in its security, but it’s hardly the first corporate entity to do so. Google, Facebook and Yahoo all offer rewards or incentives to hackers who report bugs to them privately. Netscape engineer Jarrett Ridlinghafer is largely credited with coming up with the concept of rewarding good, or “white hat,” hackers for trouble-shooting in 1995.
Jordan Wiens, founder of cybersecurity company Vector 35, was one of two winners to claim a million airline miles for his prize. He posted a screenshot of his mileage account on Twitter. (He submitted the bug on May 15, got a response on May 19, a validation notice on June 24 and then the payout on July 10.) A second bug he reported won a lesser prize of 250,000 miles. Kyle Lovett from Montgomery, Calif., was the other million-mile winner. Lovett Tweeted that he will use some of the miles to fly out his mother and brother to California.
Wow! @united really paid out! Got a million miles for my bug bounty submissions! Very cool. pic.twitter.com/CEclmhmyUq
— Jordan Wiens (@psifertex) July 10, 2015
No doubt the airline saved a ton of money in preventing computer issues. In recent months United has had to ground it flights twice as a result of computer system glitches. On June 2, an automation issue affected 150 flights, or 8 percent of its morning schedule. On July 8, a network connectivity issue due to a router malfunction locked up its reservations system and grounded thousands of flights worldwide.
Looks like the airline has more miles to dole out, too: Twitter was full of happy pronouncement from hackers claiming smaller prizes and begging Delta to do the same.
How the Emmys Made Netflix’s Very Good Week Even Better
When the Emmy nominations were announced on Thursday, there were any number of people who were hoping Netflix’s already excellent week would end with a fizzle.
The old school broadcast networks (ABC, CBS, NBC and Fox), HBO, Amazon, Hulu, AMC, BBC America and FX all had shows that were widely admired and due for recognition at the annual awards extravaganza.
Netflix, on the other hand, was coming off the widely panned season of “House of Cards,” the critically admired but little-seen “Bloodline” and “Unbreakable Kimmy Schmidt,” and the domestic flop of its $90 million historical epic, “Marco Pollo.” Additionally, “Orange Is the New Black,” which had a strong third season both in terms of reviews and ratings, was forced by a change in the Emmy rules to submit as a drama rather than a comedy, putting it up against more hard-hitting dramatic programs.
Related: How the Video Game Industry Is Failing Its Fans
As it turns out, Netflix’s very good week would keep going with a record setting 34 nominations. This is dwarfed by HBO’s 127 nominations, but this is a remarkable number for the streaming service nevertheless.
The shower of nominations came on the end of a week in which Netflix stock price continued to climb at a rapid pace, making it the single best performing stock in the S&P 500 this year. Netflix continues to grow rapidly, adding 900,000 domestic users in Q2 and a staggering 2.4 million users internationally, widely exceeding expectations of 6000,000 and 1.9 million, respectively.
If there is a downside, it is that Netflix is unlikely to actually WIN in any of the major Emmy categories. The beloved series “Mad Men” and “Parks and Recreation” should have a lock on the comedy and drama awards (and if Jonathan Banks of “Better Call Saul” doesn’t win besting supporting actor in a drama, there will be riots!). But for Netflix, it is still an honor just to be nominated.
The streaming giant will not be resting on its laurels. Coming on the back of its critically-acclaimed and bone-crunching adaptation of “Daredevil,” the company will be teaming up with Marvel again for three more shows. Netflix will also be amping up its feature film division with debuts from “True Detective” director Cary Fukunaga and an action movie starring Brad Pitt.
The company may walk away empty handed when they hand out the golden statues on September 20th, but for the time being, everything is coming up Netflix.
This Is the Best Time Since the Recession to Get a Small Business Loan

Feeling the entrepreneurial itch? This is the best time in years to start a small business with a loan from a big bank, according to a new report from online loan marketplace Biz2Credit.
Banks with $10 billion or more in assets have raised their approval rates for small business loan requests to the highest level since 2011, when Biz2Credit started tracking them. In June 2011 big banks granted a measly 8.9 percent of small loan applications. Last month they approved 22.19 percent.
“These are the best numbers for big bank lending since the recession," Biz2Credit CEO Rohit Arora said in the report.
Related: What the U.S. Must Do to Avoid Another Financial Crisis
Banks had pulled back sharply on small business lending during and after the financial crisis. As a result, startups began turning to alternative lenders and credit unions. Those other sources of funding now have approval rates of 61 percent and 43 percent respectively, but those rates have been steadily declining, making the rebound in bank loans all the more welcome.
Bank approval rates are still well below where they were before the recession — and the Biz2Credit report is based on an analysis of just 1,000 loan applications on the site — but the trend is an encouraging one for the entrepreneurs among us.
