Fitch Sends a Warning on US Credit Rating
One of the three major credit ratings agencies warned Wednesday that a failure to raise the debt ceiling could result in a lower credit rating for the U.S.
Fitch Ratings currently assigns a AAA rating to U.S. debt, the highest level possible. However, a failure to raise the debt ceiling "may not be compatible with 'AAA' status," according to the agency.
If the U.S. cannot sell more debt after bumping up against the debt ceiling, it may not be able to make all of its interest payments on time and in full. The federal government could begin running out of cash as soon as October.
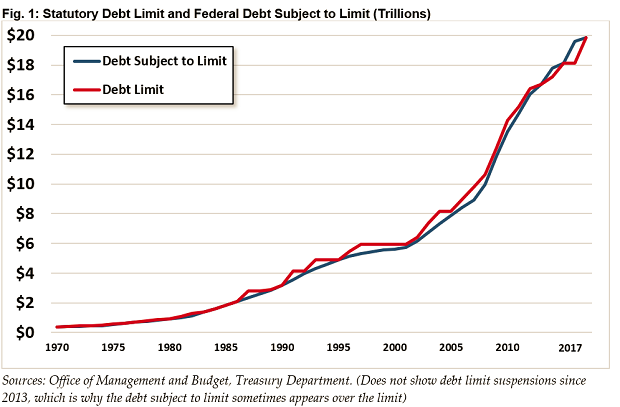
The debt ceiling is currently $19.9 trillion, and Treasury Secretary Steven Mnuchin has repeatedly urged Congress to raise the debt ceiling by September 29. A failure to do so could roil financial markets around the world, and ultimately increase the cost of servicing U.S. debt.
This is not the first time Congress has faced this problem. During an earlier debt ceiling showdown in 2011, Standard & Poor's reduced its rating on U.S. debt from its highest level to AA+. However, Fitch and Moody’s stuck with their top ratings.
Tax Refunds Rebound

Smaller refunds in the first few weeks of the current tax season were shaping up to be a political problem for Republicans, but new data from the IRS shows that the value of refund checks has snapped back and is now running 1.3 percent higher than last year. The average refund through February 23 last year was $3,103, while the average refund through February 22 of 2019 was $3,143 – a difference of $40. The chart below from J.P. Morgan shows how refunds performed over the last 3 years.

Number of the Day: $22 Trillion

The total national debt surpassed $22 trillion on Monday. Total public debt outstanding reached $22,012,840,891,685.32, to be exact. That figure is up by more than $1.3 trillion over the past 12 months and by more than $2 trillion since President Trump took office.
Chart of the Week: The Soaring Cost of Insulin

The cost of insulin used to treat Type 1 diabetes nearly doubled between 2012 and 2016, according to an analysis released this week by the Health Care Cost Institute. Researchers found that the average point-of-sale price increased “from $7.80 a day in 2012 to $15 a day in 2016 for someone using an average amount of insulin (60 units per day).” Annual spending per person on insulin rose from $2,864 to $5,705 over the five-year period. And by 2016, insulin costs accounted for nearly a third of all heath care spending for those with Type 1 diabetes (see the chart below), which rose from $12,467 in 2012 to $18,494.

Chart of the Day: Shutdown Hits Like a Hurricane

The partial government shutdown has hit the economy like a hurricane – and not just metaphorically. Analysts at the Committee for a Responsible Federal Budget said Tuesday that the shutdown has now cost the economy about $26 billion, close to the average cost of $27 billion per hurricane calculated by the Congressional Budget Office for storms striking the U.S. between 2000 and 2015. From an economic point of view, it’s basically “a self-imposed natural disaster,” CRFB said.

Chart of the Week: Lowering Medicare Drug Prices

The U.S. could save billions of dollars a year if Medicare were empowered to negotiate drug prices directly with pharmaceutical companies, according to a paper published by JAMA Internal Medicine earlier this week. Researchers compared the prices of the top 50 oral drugs in Medicare Part D to the prices for the same drugs at the Department of Veterans Affairs, which negotiates its own prices and uses a national formulary. They found that Medicare’s total spending was much higher than it would have been with VA pricing.
In 2016, for example, Medicare Part D spent $32.5 billion on the top 50 drugs but would have spent $18 billion if VA prices were in effect – or roughly 45 percent less. And the savings would likely be larger still, Axios’s Bob Herman said, since the study did not consider high-cost injectable drugs such as insulin.
