Special Tax Break Zones Defined for All 50 States

The U.S. Treasury has approved the final group of opportunity zones, which offer tax incentives for investments made in low-income areas. The zones were created by the tax law signed in December.
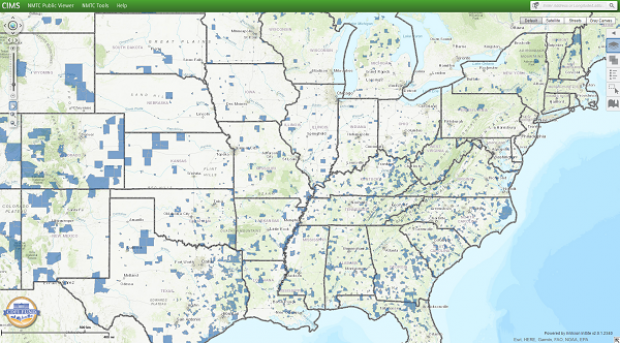
Bill Lucia of Route Fifty has some details: “Treasury says that nearly 35 million people live in the designated zones and that census tracts in the zones have an average poverty rate of about 32 percent based on figures from 2011 to 2015, compared to a rate of 17 percent for the average U.S. census tract.”
Click here to explore the dynamic map of the zones on the U.S. Treasury website.
Coming Soon: Deductible Relief Day!

You may be familiar with the concept of Tax Freedom Day – the date on which you have earned enough to pay all of your taxes for the year. Focusing on a different kind of financial burden, analysts at the Kaiser Family Foundation have created Deductible Relief Day – the date on which people in employer-sponsored insurance plans have spent enough on health care to meet the average annual deductible.
Average deductibles have more than tripled over the last decade, forcing people to spend more out of pocket each year. As a result, Deductible Relief Day is “getting later and later in the year,” Kaiser’s Larry Levitt said in a tweet Thursday.

Chart of the Day: Families Still Struggling

Ten years into what will soon be the longest economic expansion in U.S. history, 40% of families say they are still struggling, according to a new report from the Urban Institute. “Nearly 4 in 10 nonelderly adults reported that in 2018, their families experienced material hardship—defined as trouble paying or being unable to pay for housing, utilities, food, or medical care at some point during the year—which was not significantly different from the share reporting these difficulties for the previous year,” the report says. “Among adults in families with incomes below twice the federal poverty level (FPL), over 60 percent reported at least one type of material hardship in 2018.”

Chart of the Day: Pragmatism on a Public Option

A recent Morning Consult poll 3,073 U.S. adults who say they support Medicare for All shows that they are just as likely to back a public option that would allow Americans to buy into Medicare or Medicaid without eliminating private health insurance. “The data suggests that, in spite of the fervor for expanding health coverage, a majority of Medicare for All supporters, like all Americans, are leaning into their pragmatism in response to the current political climate — one which has left many skeptical that Capitol Hill can jolt into action on an ambitious proposal like Medicare for All quickly enough to wrangle the soaring costs of health care,” Morning Consult said.

Chart of the Day: The Explosive Growth of the EITC

The Earned Income Tax Credit, a refundable tax credit for low- to moderate-income workers, was established in 1975, with nominal claims of about $1.2 billion ($5.6 billion in 2016 dollars) in its first year. According to the Tax Policy Center, by 2016 “the total was $66.7 billion, almost 12 times larger in real terms.”

Chart of the Day: The Big Picture on Health Care Costs

“The health care services that rack up the highest out-of-pocket costs for patients aren't the same ones that cost the most to the health care system overall,” says Axios’s Caitlin Owens. That may distort our view of how the system works and how best to fix it. For example, Americans spend more out-of-pocket on dental services ($53 billion) than they do on hospital care ($34 billion), but the latter is a much larger part of national health care spending as a whole.
