Automakers Are Having a Record Year, but Here’s a Trend that Should Worry Them

U.S. auto sales closed out the summer on a positive note, topping estimates and casting some rosy light on the health of the American consumer. Recording its best August since 2003, the auto industry is on pace to sell 17.8 vehicles in 2015, well ahead of expectations of 17.3 million. If the numbers hold up, 2015 will be the best year ever for U.S. auto sales, beating the 17.4 million mark set in 2000.
The general consensus is that auto industry is in pretty good shape these days. Gas prices and interest rates are low, boosting the market for cars and light trucks. More than 2 million jobs were added to the U.S. economy in the past year, and more jobs is usually good news for auto sales. The unemployment rate has been trending lower for five years, sitting at a relatively healthy 5.3 percent in July.
Related: What's Next for Oil Prices? Look Out Below!
As with any statistic, though, there’s more than one way to look at the situation. Sure, auto sales are climbing as the economy gets stronger and more Americans hit their local car dealers’ lots. At least to some degree, though, higher auto sales should be expected just as a result of U.S. population growth. And those rising monthly sales figures are masking a continuing trend that is more worrisome for the auto industry: per capita auto sales are still in a long-term decline, even including the solid growth the industry has seen since the end of the recession. Doug Short at Advisor Perspectives did the math and made a graph:

According to Short’s analysis, the peak year for per capita auto sales in the U.S. was 1978. As the red line in the graph shows, the trend is negative since then.
In the graph, per capita auto sales in January, 1976, were defined as 100; the readings in the index since then are relative to that 1976 sales level. As you can see, the index moves higher until August of 1978, when per capita auto sales were up nearly 20 percent over 1976. Since then, per capita auto sales have fallen, reaching a low in 2009 that was nearly 50 percent lower than 1976. Since 2009, per capita auto sales have risen nicely, but are still more than 15 percent below peak.
What could explain the negative trend? Two factors come to mind. First, demographics. It has been widely reported that the millennial generation is less interested in owning cars for a variety of reasons, ranging from a weak economy to a cultural shift away from suburban life. However, the data on millennial car purchases is ambiguous; recently, millennials have started buying cars in volumes that look a lot like their elders. And even if millennials are less interested in buying cars, their preferences can’t explain a shift that began in the 1970s, before they were born.
Related: U.S. Companies Are Dying Faster Than Ever
The other factor that may explain the trend is income inequality. A study of car ownership by the Carnegie Foundation found that countries with higher income inequality have fewer cars per capita. The logic is simple: As more income is claimed by the wealthy, there’s less to go around for everyone else. And that means there’s less money for middle and lower income groups to buy and maintain automobiles, among other things.
Here’s a chart of the Gini index for the U.S. since 1947. (The Gini Index is a widely-used measure of income inequality. A higher Gini number means higher inequality.) Note that the Gini reading started climbing in the late ‘70s – the same time when per capita car ownership in the U.S. began to fall.
This chart tells us, not for the first time, that the U.S. has experienced more income inequality since the 1970s. Combined with the per capita auto sales data above, it suggests that as the rich have gotten richer and everyone else has struggled to keep up, car ownership has suffered. Although this is by no means proof of the relationship between income inequality and per capita car ownership over the last 40 years, it hints at an interesting theory – and suggests that the auto industry has good reason to be concerned about growing inequality in the U.S.

Top Reads From The Fiscal Times:
- 6 Reasons Gas Prices Could Fall Below $2 a Gallon
- Hoping for a Raise? Here’s How Much Most People Are Getting
- What the U.S. Must Do to Avoid Another Financial Crisis
The High Cost of Child Poverty

Childhood poverty cost $1.03 trillion in 2015, including the loss of economic productivity, increased spending on health care and increased crime rates, according to a recent study in the journal Social Work Research. That annual cost represents about 5.4 percent of U.S. GDP. “It is estimated that for every dollar spent on reducing childhood poverty, the country would save at least $7 with respect to the economic costs of poverty,” says Mark R. Rank, a co-author of the study and professor of social welfare at Washington University in St. Louis. (Futurity)
Do You Know What Your Tax Rate Is?

Complaining about taxes is a favorite American pastime, and the grumbling might reach its annual peak right about now, as tax day approaches. But new research from Michigan State University highlighted by the Money magazine website finds that Americans — or at least Michiganders — dramatically overstate their average tax rate.
In a survey of 978 adults in the Wolverine State, almost 220 people said they didn’t know what percentage of their income went to federal taxes. Of the people who did provide an answer, almost 85 percent overstated their actual rate, sometimes by a large margin. On average, those taxpayers said they pay 25.5 percent of their income in federal taxes. But the study’s authors estimated that their actual average tax rate was just under 14 percent.
The large number of people who didn’t want to venture a guess as to their tax rate and the even larger number who were wildly off both suggest to the researchers “that a very substantial portion of the population is uninformed or misinformed about average federal income-tax rates.”
Why don’t we know what we’re paying?
Part of the answer may be that our tax system is complicated and many of us rely on professionals or specialized software to prepare our filings. Money’s Ian Salisbury notes that taxpayers in the survey who relied on that kind of help tended to be further off in their estimates, after controlling for other factors.
Also, many people likely don’t understand the different types of taxes they pay. While the survey asked specifically about federal taxes, the tax rates people provided more closely matched their total tax rate, including federal, state, local and payroll taxes.
But our politics likely play a role here as well. People who believe that taxes on households like theirs should be lower and those who believe tax dollars are spent ineffectively tended to overstate their tax rates more.
“Since the time of Ronald Reagan, American[s] have been inundated with messages about how high taxes are,” one of the study’s authors told Salisbury. “The notion they are too high has become deeply ingrained.”
Wealthy Investors Are Worried About Washington, and the Debt
A new survey by the Spectrem Group, a market research firm, finds that almost 80 percent of investors with net worth between $100,000 and $25 million (not including their home) say that the U.S. political environment is their biggest concern, followed by government gridlock (76 percent) and the national debt (75 percent).
Trump’s Push to Reverse Parts of $1.3 Trillion Spending Bill May Be DOA
At least two key Republican senators are unlikely to support an effort to roll back parts of the $1.3. trillion spending bill passed by Congress last month, The Washington Post’s Mike DeBonis reported Monday evening. While aides to President Trump are working with House Majority Leader Kevin McCarthy (R-CA) on a package of spending cuts, Sens. Susan Collins (R-ME) and Lisa Murkowski (R-AK) expressed opposition to the idea, meaning a rescission bill might not be able to get a simple majority vote in the Senate. And Roll Call reports that other Republican senators have expressed significant skepticism, too. “It’s going nowhere,” Sen. Lindsey Graham said.
Goldman Sees Profit in the Tax Cuts
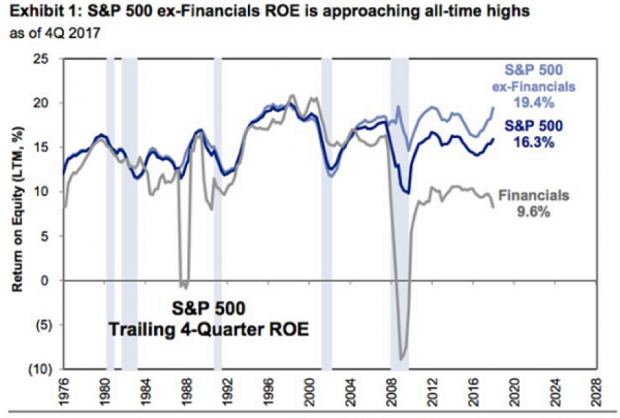
David Kostin, chief U.S. equity strategist at Goldman Sachs, said in a note to clients Friday cited by CNBC that companies in the S&P 500 can expect to see a boost in return on equity (ROE) thanks to the tax cuts. Return on equity should hit the highest level since 2007, Kostin said, providing a strong tailwind for stock prices even as uncertainty grows about possible conflicts over trade.
Return on equity, defined as the amount of net income returned as a percentage of shareholders’ equity, rose to 16.3 percent in 2016, and Kostin is forecasting an increase to 17.6 percent in 2018. "The reduction in the corporate tax rate alone will boost ROE by roughly 70 [basis points], outweighing margin pressures from rising labor, commodity, and borrow costs," Kostin wrote.