Automakers Are Having a Record Year, but Here’s a Trend that Should Worry Them

U.S. auto sales closed out the summer on a positive note, topping estimates and casting some rosy light on the health of the American consumer. Recording its best August since 2003, the auto industry is on pace to sell 17.8 vehicles in 2015, well ahead of expectations of 17.3 million. If the numbers hold up, 2015 will be the best year ever for U.S. auto sales, beating the 17.4 million mark set in 2000.
The general consensus is that auto industry is in pretty good shape these days. Gas prices and interest rates are low, boosting the market for cars and light trucks. More than 2 million jobs were added to the U.S. economy in the past year, and more jobs is usually good news for auto sales. The unemployment rate has been trending lower for five years, sitting at a relatively healthy 5.3 percent in July.
Related: What's Next for Oil Prices? Look Out Below!
As with any statistic, though, there’s more than one way to look at the situation. Sure, auto sales are climbing as the economy gets stronger and more Americans hit their local car dealers’ lots. At least to some degree, though, higher auto sales should be expected just as a result of U.S. population growth. And those rising monthly sales figures are masking a continuing trend that is more worrisome for the auto industry: per capita auto sales are still in a long-term decline, even including the solid growth the industry has seen since the end of the recession. Doug Short at Advisor Perspectives did the math and made a graph:

According to Short’s analysis, the peak year for per capita auto sales in the U.S. was 1978. As the red line in the graph shows, the trend is negative since then.
In the graph, per capita auto sales in January, 1976, were defined as 100; the readings in the index since then are relative to that 1976 sales level. As you can see, the index moves higher until August of 1978, when per capita auto sales were up nearly 20 percent over 1976. Since then, per capita auto sales have fallen, reaching a low in 2009 that was nearly 50 percent lower than 1976. Since 2009, per capita auto sales have risen nicely, but are still more than 15 percent below peak.
What could explain the negative trend? Two factors come to mind. First, demographics. It has been widely reported that the millennial generation is less interested in owning cars for a variety of reasons, ranging from a weak economy to a cultural shift away from suburban life. However, the data on millennial car purchases is ambiguous; recently, millennials have started buying cars in volumes that look a lot like their elders. And even if millennials are less interested in buying cars, their preferences can’t explain a shift that began in the 1970s, before they were born.
Related: U.S. Companies Are Dying Faster Than Ever
The other factor that may explain the trend is income inequality. A study of car ownership by the Carnegie Foundation found that countries with higher income inequality have fewer cars per capita. The logic is simple: As more income is claimed by the wealthy, there’s less to go around for everyone else. And that means there’s less money for middle and lower income groups to buy and maintain automobiles, among other things.
Here’s a chart of the Gini index for the U.S. since 1947. (The Gini Index is a widely-used measure of income inequality. A higher Gini number means higher inequality.) Note that the Gini reading started climbing in the late ‘70s – the same time when per capita car ownership in the U.S. began to fall.
This chart tells us, not for the first time, that the U.S. has experienced more income inequality since the 1970s. Combined with the per capita auto sales data above, it suggests that as the rich have gotten richer and everyone else has struggled to keep up, car ownership has suffered. Although this is by no means proof of the relationship between income inequality and per capita car ownership over the last 40 years, it hints at an interesting theory – and suggests that the auto industry has good reason to be concerned about growing inequality in the U.S.

Top Reads From The Fiscal Times:
- 6 Reasons Gas Prices Could Fall Below $2 a Gallon
- Hoping for a Raise? Here’s How Much Most People Are Getting
- What the U.S. Must Do to Avoid Another Financial Crisis
Americans Are Happier with This Car Brand Than Any Other

Americans may love their cars, but these days they love them a little less.
Consumer satisfaction with their cars has fallen for the third consecutive year, reflecting unhappiness with increasing recalls and rising prices, according to new data from the American Customer Satisfaction Index.
Car reliability has improved overall in the past decade but the number of recalls is at an all-time high. “This should not happen with modern manufacturing technology and has negative consequences for driver safety, costs, and customer satisfaction,” ACSI Chairman and founder Claes Fornell said in a statement.
Car owners in the second quarter of 2015 reported a 40 percent increase in recalls year over year. The most high profile recalls involve Takata airbags, affecting more than 17 million older-model vehicles built by 11 different auto makers.
Related: Senators Urge Recall of All Vehicles with Takata Airbags
Looking at individual brands, the index shows that Americans prefer Japanese and luxury brand cars, with Lexus displacing Mercedes Benz as the brand with the highest overall satisfaction (84 out of 100). Mercedes tied for second place with Acura and Lincoln.
The average for all autos fell 3.7 points to 79. The only American automaker to rank above average was Ford with a score of 81. General Motors and Chrysler saw their scores fall modestly to 79 and 75 respectively.
Despite a growing decline in satisfaction, Americans are holding onto their vehicles longer than ever. The average age of cars and light trucks is now 11.5 years old, according to a report issued last month by IHS Automotive.
Top Reads from the Fiscal Times:
- Big Surprise: Hispanic Voters Can’t Stand Donald Trump
- How a Biden-Warren Ticket Could Transform the Campaign
- Air Force Brushes Off $27 Billion Accounting Error
Watch Chris Christie Play the Enforcer in His Latest Ad
New Jersey Gov. Chris Christie’s presidential campaign has adopted “Telling It Like It Is” as its slogan and, according to his latest national television ad, he wants to tell voters just how scary the world is today.
The 30-second spot, titled “Law Enforcer,” opens with Christie decrying “lawlessness in America and around the world under Barack Obama.”
He rattles off a series of threats, speaking over dramatic music cues and flashing images.
Related: As Stocks Tank, Trump Warns China Could ‘Bring Us Down’
“Sanctuary cities engulfing Americans in crime. Drugs running rampant and destroying lives. ISIS beheading Christians. Iranian radicals with nuclear weapons,” he says ominously.
“Now, Hillary Clinton thinks the law doesn't apply to her,” Christie asks as images of a computer server appear on screen. “Really?”
The former U.S. attorney argues that the country needs a “strong law enforcer as president, someone who says what he means and means what he says.”
The doom and gloom ad, featuring a score more typical of a television drama than a presidential ad, is running on the Fox News Channel and marks Christie’s latest attempt to spark interest in his White House bid.
The two-term governor has consistently lost support in opinion polls since the inaugural GOP presidential debate, while political outsiders like Donald Trump, Ben Carson and Carly Fiorina have surged.
Related: Rand Paul Gets a Break in Kentucky, but It’s Going to Cost Him
Last week a CNN/ORC survey put Christie in 11th place, garnering only three percent support among GOP voters.
If the trend continues, Christie could lose his spot on the main stage at the CNN/Reagan Library debate on September 16 and relegated to the second-tier.
Top Reads from the Fiscal Times:
- Democrats Are Openly Speculating About an Election without Hillary Clinton
- Scott Walker Adjusts His Immigration Stance. Again
- The 10 Best States for Property Taxes
How to Cut Your Homeowner’s Insurance in Half

That lousy credit score is costing you more than a good rate on a loan.
Insurance premiums for homeowners with excellent credit are half the price of premiums for homeowners with poor credit, according to a new report by insuranceQuotes.com. Homeowners with median credit pay about a third more than those with excellent credit.
The difference in premiums varies by state, with homeowners with poor credit in 38 states paying at least twice as much those with excellent credit. Homeowners in West Virginia have the biggest premium gap, with those with poor credit paying more than three times what homeowners with excellent credit pay.
Homeowners in Washington, D.C., and Ohio had the next highest gap in premiums (185 percent), followed by Montana (179 percent).
Related; The Easiest Way to Cut Your Home Insurance Premiums
In general, insurers are putting a higher emphasis on credit scores than they did last year, with scores having a bigger impact this year than last in 29 states. “It’s more important than ever to maintain a solid credit rating by paying their bills on time, keeping their balances low, and correcting errors on their credit reports,” Laura Adams, insurangeQuotes.com senior analyst said in a statement.
California, Massachusetts and Maryland do not allow insurers to consider credit in setting prices, and insurers in Florida don’t use it.
The average U.S. homeowner’s insurance premium is around $950. In addition to making an effort to boost their credit, homeowners should shop around every few years to see if they can find a better rate.
Top Reads from the Fiscal Times:
- The 10 Best States for Property Taxes
- Democrats Are Openly Speculating About an Election without Hillary Clinton
- California’s Latest Nightmare: San Joaquin Valley Is Sinking
Dow Sheds Nearly 600 Points, S&P 500 in Correction in a Wild Day on Wall Street
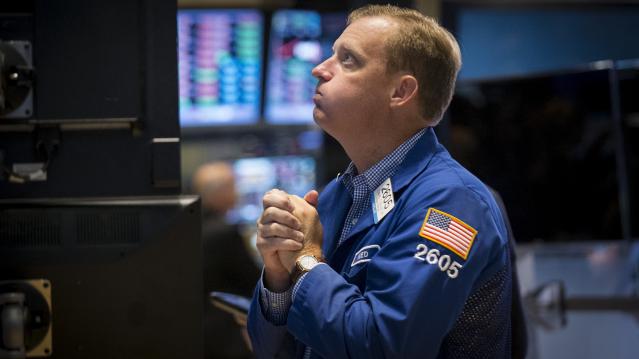
U.S. stocks plunged more than 3.5 percent on Monday, closing off session lows in high volume trade as fears of slowing growth in China pressured global markets.
S&P 500 ended nearly 80 points lower, off session lows of about 104 points lower but still in correction territory after the tech sector failed intraday attempts to post gains. Cumulative trade volume was 13.94 billion shares, the highest volume day since Aug. 10, 2011.
The major averages had a volatile day of trade, plunging sharply in the open and more than halving losses to trade less than 1 percent lower on the day, before closing down more than 3.5 percent.
"I think we probably rallied too fast. A lot of people that covered their shorts got their shorts covered," said Peter Coleman, head trader at Convergex. He noted the Dow was still trading several hundred points off session lows and that a close better than 500 points lower would be a good sign.
Related: The Stock Market's Fed Fever Is Only Going to Get Worse
"The market's going to be focused on China tonight to see if they come on tonight with something that would be considered a viable (way) to stimulate growth in that economy," said Quincy Krosby, market strategist at Prudential Financial.
The Dow Jones industrial average ended nearly 600 points lower after trading in wide range of between roughly 300 to 700 points lower in the minutes leading up to the close.
In the open, the index fell as much as 1,089 points, making Monday's move its biggest intraday swing in history. In midday trade, the index pared losses to trade about 110 points lower.
The blue-chip index posted its biggest 3-day point loss in history of 1,477.45 points.
During the first 90 minutes of trade, the index traveled more than 3,000 points in down and up moves.
"I'm hoping for some stability here but I think markets remain very, very vulnerable to bad news (out of) emerging markets," said Dan Veru, chief investment officer at Palisade Capital Management.
He attributed some of the sharp opening losses to exchange-traded funds. "It's so easy to move a bajillion dollars in a nanosecond."
Trading in stocks and exchange-traded funds was paused more than 1,200 times on Monday, Dow Jones said, citing exchanges. Such pauses total single digits on a normal day, the report said. An increase or decline of five percent or more triggers a five-minute pause in trading, Dow Jones said.
The major averages came sharply off lows in midday trade, with the Nasdaq off as low as less than half a percent after earlier falling 8.8 percent. Apple traded more than 1.5 percent lower after reversing losses to briefly jump more than 2 percent.
"There was sort of a lack of follow-through after the morning's crazy action in the overall market," said Robert Pavlik, chief market strategist at Boston Private Wealth. "The selling really dissipated once we got to around 10 o'clock."
He attributed some of the late morning gains to a short squeeze and bargain hunting.
Art Hogan, chief market strategist at Wunderlich Securities, noted that the sharp opening losses were due to great uncertainty among traders and the implementation of a rare market rule.
The New York Stock Exchange invoked Rule 48 for the Monday stock market open, Dow Jones reported.
The rule allows NYSE to open stocks without indications. "It was set up for situations like this," Hogan said. The rule was last used in the financial crisis.
Stock index futures for several major indices fell several percentage points before the open to hit limit down levels.
Circuit breakers for the S&P 500 will halt trade when the index decreases from its previous close by the following three levels: 7 percent, 13 percent, and 20 percent.
"Fear has taken over. The market topped out last week," said Adam Sarhan, CEO of Sarhan Capital. "We saw important technical levels break last week. Huge shift in investor psychology."
"The market is not falling on actual facets of a sub-prime situation. It's falling on fear of the unload of China. That's really behind this move," said Peter Cardillo, chief market economist at Rockwell Global Capital.
The CBOE Volatility Index (VIX), considered the best gauge of fear in the market, traded near 40. Earlier in the session the index leaped above 50 for the first time since February 2009.
"When the VIX is this high it means there's some panic out there," said Randy Frederick, managing director of trading and derivatives at Charles Schwab.
However, he said with stocks more than halving losses he "wouldn't be surprised if we closed positive." "If you could move it that far you could move it another 350 points" on the Dow," he said.
Overseas, European stocks plunged, with the STOXX Europe 600 down more than 5 percent, while the Shanghai Composite dropped 8.5 percent, its greatest one-day drop since 2007.
Treasury yields came off session lows, with the U.S. 10-year yield at 2.01 percent and the 2-year yield at 0.58 percent.
The U.S. dollar fell more than 1.5 percent against major world currencies, with the euro near $1.16 and the yen stronger at 119 yen versus the greenback.
A U.S. Treasury Department spokesperson said in a statement that "We do not comment on day-to-day market developments. As always, the Treasury Department is monitoring ongoing market developments and is in regular communication with its regulatory partners and market participants."
The Dow transports ended more than 3.5 percent lower to approach bear market territory.
About 10 stocks declined for every advancer on the New York Stock Exchange, with an exchange volume of 901 million and a composite volume of 4 billion as of 2:05 p.m.
Crude oil futures settled down $2.21, or 5.46 percent, at $38.24 a barrel, the lowest since February 2009. In intraday trade, crude oil futures for October delivery fell as much as $2.70 to $37.75 a barrel, a six-and-a-half-year low.
Gold futures settled down $6.10 at $1,153.60 an ounce.
This post originally appeared on CNBC. Read More at CNBC:
- Wharton's Siegel: We're going to test, possibly break this morning's lows
- Barclays: Fed unlikely to hike before March 2016
- One of Wall St's biggest bulls throws in the towel
Dow Plunges into Correction Territory: Here’s How Bad Friday’s Market Bloodbath Was
U.S. stocks closed sharply lower on Friday as slowing growth in China and worries about a possible rate hike by the Fed took their toll. The Dow Jones Industrial Average finished the day down 531 points for a 3.12 percent loss. The S&P lost 65 points (-3.16 percent) — its worst day since Aug. 8, 2011 — and the Nasdaq lost 171 (-3.52 percent). For the first time since 2011, the Dow is now in a correction, meaning it has lost 10 percent from its peak. The S&P is nearing correction territory, too, having lost 7.5 percent since its May 21 closing high.
Related: The Stock Market's Fed Fever Is Only Going to Get Worse
The selloff was widespread, with 491 of the S&P 500 stocks ending the day in the red and only 11 managing to advance (the S&P 500 actually includes 502 stocks). For the week, 487 of the S&P 500 stocks fell and only 15 gained. In total, the S&P 500 lost a collective $1.14 trillion in market value on the week. Yes, trillion with a "T."
This snapshot from finviz of the performance of stocks in the S&P 500 gives a sense of Friday's carnage (Click it to enlarge):
